Advertisement
- United States
- /
- Communications
- /
- NasdaqGM:OCC
Is Optical Cable (NASDAQ:OCC) Using Too Much Debt?
David Iben put it well when he said, 'Volatility is not a risk we care about. What we care about is avoiding the permanent loss of capital.' It's only natural to consider a company's balance sheet when you examine how risky it is, since debt is often involved when a business collapses. We can see that Optical Cable Corporation (NASDAQ:OCC) does use debt in its business. But the real question is whether this debt is making the company risky.
When Is Debt A Problem?
Debt is a tool to help businesses grow, but if a business is incapable of paying off its lenders, then it exists at their mercy. Ultimately, if the company can't fulfill its legal obligations to repay debt, shareholders could walk away with nothing. However, a more frequent (but still costly) occurrence is where a company must issue shares at bargain-basement prices, permanently diluting shareholders, just to shore up its balance sheet. By replacing dilution, though, debt can be an extremely good tool for businesses that need capital to invest in growth at high rates of return. When we think about a company's use of debt, we first look at cash and debt together.
See our latest analysis for Optical Cable
What Is Optical Cable's Debt?
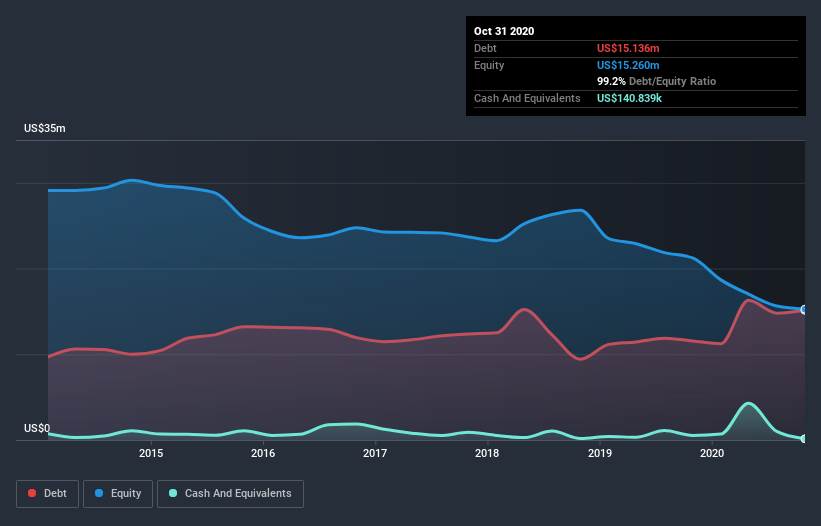
As you can see below, at the end of October 2020, Optical Cable had US$15.1m of debt, up from US$11.6m a year ago. Click the image for more detail. Net debt is about the same, since the it doesn't have much cash.
How Healthy Is Optical Cable's Balance Sheet?
Zooming in on the latest balance sheet data, we can see that Optical Cable had liabilities of US$6.27m due within 12 months and liabilities of US$15.0m due beyond that. Offsetting this, it had US$140.8k in cash and US$7.61m in receivables that were due within 12 months. So it has liabilities totalling US$13.5m more than its cash and near-term receivables, combined.
This is a mountain of leverage relative to its market capitalization of US$21.3m. Should its lenders demand that it shore up the balance sheet, shareholders would likely face severe dilution. The balance sheet is clearly the area to focus on when you are analysing debt. But you can't view debt in total isolation; since Optical Cable will need earnings to service that debt. So when considering debt, it's definitely worth looking at the earnings trend. Click here for an interactive snapshot.
In the last year Optical Cable had a loss before interest and tax, and actually shrunk its revenue by 22%, to US$55m. To be frank that doesn't bode well.
Caveat Emptor
While Optical Cable's falling revenue is about as heartwarming as a wet blanket, arguably its earnings before interest and tax (EBIT) loss is even less appealing. Indeed, it lost a very considerable US$5.5m at the EBIT level. Considering that alongside the liabilities mentioned above does not give us much confidence that company should be using so much debt. So we think its balance sheet is a little strained, though not beyond repair. Another cause for caution is that is bled US$3.7m in negative free cash flow over the last twelve months. So suffice it to say we consider the stock very risky. There's no doubt that we learn most about debt from the balance sheet. However, not all investment risk resides within the balance sheet - far from it. To that end, you should learn about the 4 warning signs we've spotted with Optical Cable (including 2 which are significant) .
At the end of the day, it's often better to focus on companies that are free from net debt. You can access our special list of such companies (all with a track record of profit growth). It's free.
When trading Optical Cable or any other investment, use the platform considered by many to be the Professional's Gateway to the Worlds Market, Interactive Brokers. You get the lowest-cost* trading on stocks, options, futures, forex, bonds and funds worldwide from a single integrated account. Promoted
New: AI Stock Screener & Alerts
Our new AI Stock Screener scans the market every day to uncover opportunities.
• Dividend Powerhouses (3%+ Yield)
• Undervalued Small Caps with Insider Buying
• High growth Tech and AI Companies
Or build your own from over 50 metrics.
This article by Simply Wall St is general in nature. It does not constitute a recommendation to buy or sell any stock, and does not take account of your objectives, or your financial situation. We aim to bring you long-term focused analysis driven by fundamental data. Note that our analysis may not factor in the latest price-sensitive company announcements or qualitative material. Simply Wall St has no position in any stocks mentioned.
*Interactive Brokers Rated Lowest Cost Broker by StockBrokers.com Annual Online Review 2020
Have feedback on this article? Concerned about the content? Get in touch with us directly. Alternatively, email editorial-team (at) simplywallst.com.
About NasdaqGM:OCC
Optical Cable
Manufactures and sells fiber optic and copper data communications cabling and connectivity solutions primarily for the enterprise market in the United States and internationally.
Acceptable track record with mediocre balance sheet.
Similar Companies
Market Insights


Advertisement
Weekly Picks
LO


Lou_Basenese on Cue Biopharma ·
Cue Biopharma (NASDAQ: CUE): The Scientist Behind Xolair Just Gave Cue a Next-Generation Shot at the Same Multi-Billion-Dollar Market
Fair Value:US$7065.0% undervalued
42 followersusers have followed this narrative
0 commentsusers have commented on this narrative
8 likesusers have liked this narrative
HA


HarishPK on Adobe ·
Adobe: A Probabilistic Case for Undervaluation
Fair Value:US$319.9636.2% undervalued
46 followersusers have followed this narrative
8 commentsusers have commented on this narrative
16 likesusers have liked this narrative
NI


niteco on Broadcom ·
A Capital Allocation Favorite with Structural Importance
Fair Value:US$651.0541.3% undervalued
45 followersusers have followed this narrative
0 commentsusers have commented on this narrative
8 likesusers have liked this narrative
TO


Tokyo on Okta ·
Good foundation, but now it's all about the next steps
Fair Value:US$15123.0% undervalued
91 followersusers have followed this narrative
7 commentsusers have commented on this narrative
11 likesusers have liked this narrative
Recently Updated Narratives
TA


Talos on Advanced Micro Devices ·
The "David vs. Goliath" AI Trade – Why Second Place is Worth Billions
Fair Value:US$907.3243.6% undervalued
35 followersusers have followed this narrative
1 commentusers have commented on this narrative
0 likesusers have liked this narrative
JA


Janpeo on Space Exploration Technologies ·
The trap for retailers that can evaporate more than 80% of the value.
Fair Value:US$28.55463.7% overvalued
1 followerusers have followed this narrative
0 commentsusers have commented on this narrative
0 likesusers have liked this narrative
AS


AstrisCorporateAdvisory on Macbee Planet ·
Approaching an inflection point
Fair Value:JP¥1.08k7.2% undervalued
1 followerusers have followed this narrative
0 commentsusers have commented on this narrative
0 likesusers have liked this narrative
Popular Narratives
MA


martinarauz on Nu Holdings ·
Investment Analysis (May 2026)
Fair Value:US$22.7446.4% undervalued
66 followersusers have followed this narrative
0 commentsusers have commented on this narrative
16 likesusers have liked this narrative
CL


Clive_Thompson on Take-Two Interactive Software ·
Take-Two Interactive: The Calm Before the Storm NASDAQ: TTWO Last Price: $242.41 Date: May 15, 2026
Fair Value:US$276.9723.5% undervalued
58 followersusers have followed this narrative
0 commentsusers have commented on this narrative
14 likesusers have liked this narrative
NI

niteco on Honeywell International ·
Honeywell - The Demand-Side of the AI Infrastructure
Fair Value:US$320.1931.2% undervalued
50 followersusers have followed this narrative
0 commentsusers have commented on this narrative
19 likesusers have liked this narrative
