- United States
- /
- Tech Hardware
- /
- NasdaqGS:NTAP
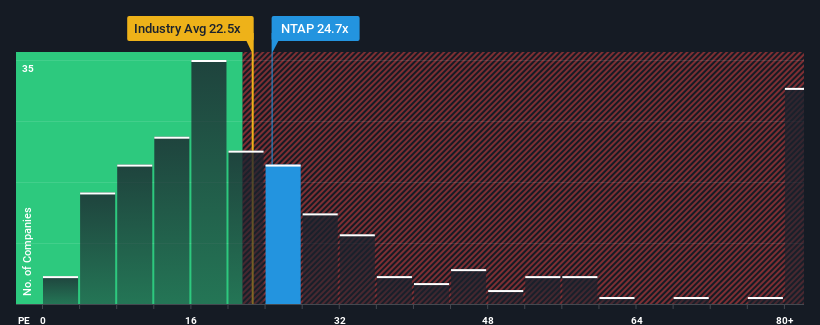
Unpleasant Surprises Could Be In Store For NetApp, Inc.'s (NASDAQ:NTAP) Shares

NetApp, Inc.'s (NASDAQ:NTAP) price-to-earnings (or "P/E") ratio of 24.7x might make it look like a sell right now compared to the market in the United States, where around half of the companies have P/E ratios below 17x and even P/E's below 9x are quite common. However, the P/E might be high for a reason and it requires further investigation to determine if it's justified.
Recent times haven't been advantageous for NetApp as its earnings have been falling quicker than most other companies. One possibility is that the P/E is high because investors think the company will turn things around completely and accelerate past most others in the market. You'd really hope so, otherwise you're paying a pretty hefty price for no particular reason.
See our latest analysis for NetApp
What Are Growth Metrics Telling Us About The High P/E?
The only time you'd be truly comfortable seeing a P/E as high as NetApp's is when the company's growth is on track to outshine the market.
If we review the last year of earnings, dishearteningly the company's profits fell to the tune of 24%. Still, the latest three year period has seen an excellent 71% overall rise in EPS, in spite of its unsatisfying short-term performance. Accordingly, while they would have preferred to keep the run going, shareholders would probably welcome the medium-term rates of earnings growth.
Turning to the outlook, the next year should generate growth of 8.9% as estimated by the analysts watching the company. Meanwhile, the rest of the market is forecast to expand by 12%, which is noticeably more attractive.
In light of this, it's alarming that NetApp's P/E sits above the majority of other companies. Apparently many investors in the company are way more bullish than analysts indicate and aren't willing to let go of their stock at any price. There's a good chance these shareholders are setting themselves up for future disappointment if the P/E falls to levels more in line with the growth outlook.
The Bottom Line On NetApp's P/E
While the price-to-earnings ratio shouldn't be the defining factor in whether you buy a stock or not, it's quite a capable barometer of earnings expectations.
We've established that NetApp currently trades on a much higher than expected P/E since its forecast growth is lower than the wider market. When we see a weak earnings outlook with slower than market growth, we suspect the share price is at risk of declining, sending the high P/E lower. This places shareholders' investments at significant risk and potential investors in danger of paying an excessive premium.
The company's balance sheet is another key area for risk analysis. Our free balance sheet analysis for NetApp with six simple checks will allow you to discover any risks that could be an issue.
Of course, you might also be able to find a better stock than NetApp. So you may wish to see this free collection of other companies that have reasonable P/E ratios and have grown earnings strongly.
Mobile Infrastructure for Defense and Disaster
The next wave in robotics isn't humanoid. Its fully autonomous towers delivering 5G, ISR, and radar in under 30 minutes, anywhere.
Get the investor briefing before the next round of contracts
Sponsored On Behalf of CiTechValuation is complex, but we're here to simplify it.
Discover if NetApp might be undervalued or overvalued with our detailed analysis, featuring fair value estimates, potential risks, dividends, insider trades, and its financial condition.
Access Free AnalysisHave feedback on this article? Concerned about the content? Get in touch with us directly. Alternatively, email editorial-team (at) simplywallst.com.
This article by Simply Wall St is general in nature. We provide commentary based on historical data and analyst forecasts only using an unbiased methodology and our articles are not intended to be financial advice. It does not constitute a recommendation to buy or sell any stock, and does not take account of your objectives, or your financial situation. We aim to bring you long-term focused analysis driven by fundamental data. Note that our analysis may not factor in the latest price-sensitive company announcements or qualitative material. Simply Wall St has no position in any stocks mentioned.
About NasdaqGS:NTAP
NetApp
Provides a range of enterprise software, systems, and services that customers use to transform their data infrastructures in the United States, Canada, Latin America, Europe, the Middle East, Africa, and the Asia Pacific.
Undervalued with excellent balance sheet and pays a dividend.
Market Insights

Weekly Picks

Early mover in a fast growing industry. Likely to experience share price volatility as they scale


A case for CA$31.80 (undiluted), aka 8,616% upside from CA$0.37 (an 86 bagger!).


Moderation and Stabilisation: HOLD: Fair Price based on a 4-year Cycle is $12.08
Recently Updated Narratives


An amazing opportunity to potentially get a 100 bagger

Amazon: Why the World’s Biggest Platform Still Runs on Invisible Economics

Sunrun Stock: When the Energy Transition Collides With the Cost of Capital
Popular Narratives


MicroVision will explode future revenue by 380.37% with a vision towards success


Crazy Undervalued 42 Baggers Silver Play (Active & Running Mine)

