

Legendary fund manager Li Lu (who Charlie Munger backed) once said, 'The biggest investment risk is not the volatility of prices, but whether you will suffer a permanent loss of capital.' So it seems the smart money knows that debt - which is usually involved in bankruptcies - is a very important factor, when you assess how risky a company is. We can see that NetApp, Inc. (NASDAQ:NTAP) does use debt in its business. But the more important question is: how much risk is that debt creating?
Why Does Debt Bring Risk?
Generally speaking, debt only becomes a real problem when a company can't easily pay it off, either by raising capital or with its own cash flow. If things get really bad, the lenders can take control of the business. However, a more usual (but still expensive) situation is where a company must dilute shareholders at a cheap share price simply to get debt under control. Having said that, the most common situation is where a company manages its debt reasonably well - and to its own advantage. When we think about a company's use of debt, we first look at cash and debt together.
See our latest analysis for NetApp
What Is NetApp's Debt?
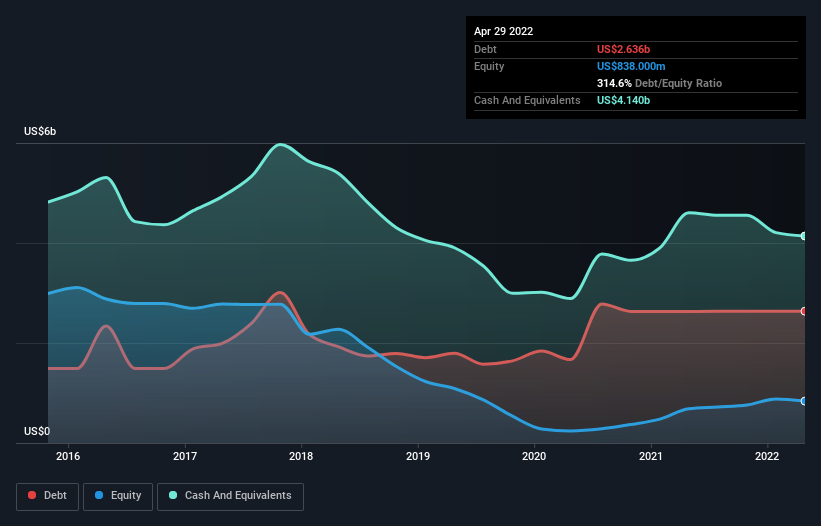
As you can see below, NetApp had US$2.64b of debt, at April 2022, which is about the same as the year before. You can click the chart for greater detail. But it also has US$4.14b in cash to offset that, meaning it has US$1.50b net cash.
How Strong Is NetApp's Balance Sheet?
We can see from the most recent balance sheet that NetApp had liabilities of US$3.95b falling due within a year, and liabilities of US$5.24b due beyond that. Offsetting these obligations, it had cash of US$4.14b as well as receivables valued at US$1.23b due within 12 months. So it has liabilities totalling US$3.82b more than its cash and near-term receivables, combined.
NetApp has a very large market capitalization of US$15.7b, so it could very likely raise cash to ameliorate its balance sheet, if the need arose. But it's clear that we should definitely closely examine whether it can manage its debt without dilution. Despite its noteworthy liabilities, NetApp boasts net cash, so it's fair to say it does not have a heavy debt load!
Another good sign is that NetApp has been able to increase its EBIT by 28% in twelve months, making it easier to pay down debt. The balance sheet is clearly the area to focus on when you are analysing debt. But ultimately the future profitability of the business will decide if NetApp can strengthen its balance sheet over time. So if you want to see what the professionals think, you might find this free report on analyst profit forecasts to be interesting.
Finally, a company can only pay off debt with cold hard cash, not accounting profits. While NetApp has net cash on its balance sheet, it's still worth taking a look at its ability to convert earnings before interest and tax (EBIT) to free cash flow, to help us understand how quickly it is building (or eroding) that cash balance. Over the last three years, NetApp actually produced more free cash flow than EBIT. That sort of strong cash conversion gets us as excited as the crowd when the beat drops at a Daft Punk concert.
Summing Up
While NetApp does have more liabilities than liquid assets, it also has net cash of US$1.50b. The cherry on top was that in converted 101% of that EBIT to free cash flow, bringing in US$985m. So we don't think NetApp's use of debt is risky. There's no doubt that we learn most about debt from the balance sheet. However, not all investment risk resides within the balance sheet - far from it. To that end, you should be aware of the 1 warning sign we've spotted with NetApp .
Of course, if you're the type of investor who prefers buying stocks without the burden of debt, then don't hesitate to discover our exclusive list of net cash growth stocks, today.
Valuation is complex, but we're here to simplify it.
Discover if NetApp might be undervalued or overvalued with our detailed analysis, featuring fair value estimates, potential risks, dividends, insider trades, and its financial condition.
Access Free AnalysisHave feedback on this article? Concerned about the content? Get in touch with us directly. Alternatively, email editorial-team (at) simplywallst.com.
This article by Simply Wall St is general in nature. We provide commentary based on historical data and analyst forecasts only using an unbiased methodology and our articles are not intended to be financial advice. It does not constitute a recommendation to buy or sell any stock, and does not take account of your objectives, or your financial situation. We aim to bring you long-term focused analysis driven by fundamental data. Note that our analysis may not factor in the latest price-sensitive company announcements or qualitative material. Simply Wall St has no position in any stocks mentioned.
About NasdaqGS:NTAP
NetApp
Provides a range of enterprise software, systems, and services that customers use to transform their data infrastructures in the United States, Canada, Latin America, Europe, the Middle East, Africa, and the Asia Pacific.
Very undervalued with excellent balance sheet and pays a dividend.
Market Insights

Community Narratives

