
Advertisement
- United States
- /
- Electronic Equipment and Components
- /
- NasdaqGS:KE
Here's How P/E Ratios Can Help Us Understand Kimball Electronics, Inc. (NASDAQ:KE)

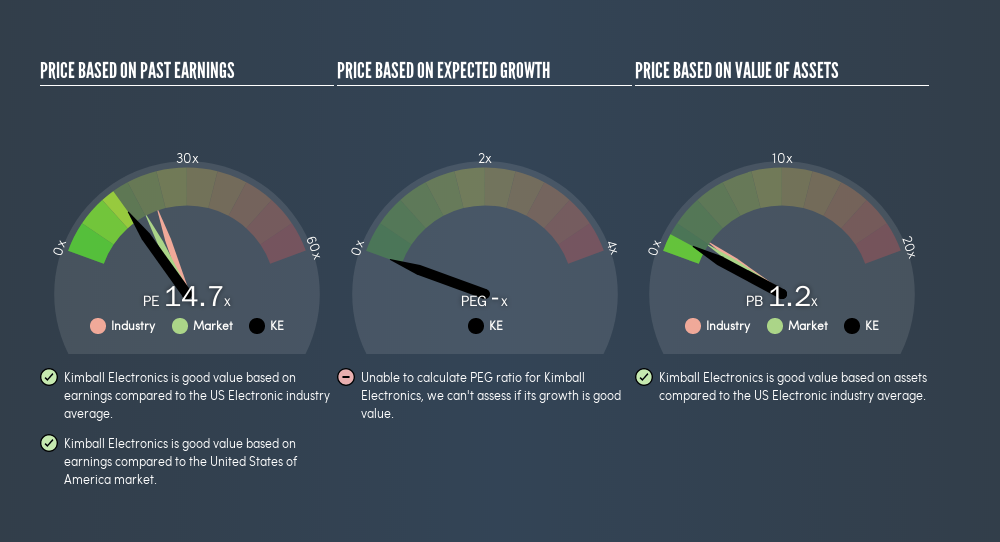
This article is for investors who would like to improve their understanding of price to earnings ratios (P/E ratios). We'll show how you can use Kimball Electronics, Inc.'s (NASDAQ:KE) P/E ratio to inform your assessment of the investment opportunity. What is Kimball Electronics's P/E ratio? Well, based on the last twelve months it is 14.75. That is equivalent to an earnings yield of about 6.8%.
See our latest analysis for Kimball Electronics
How Do You Calculate A P/E Ratio?
The formula for price to earnings is:
Price to Earnings Ratio = Price per Share ÷ Earnings per Share (EPS)
Or for Kimball Electronics:
P/E of 14.75 = $16.04 ÷ $1.09 (Based on the year to December 2018.)
Is A High P/E Ratio Good?
The higher the P/E ratio, the higher the price tag of a business, relative to its trailing earnings. That is not a good or a bad thing per se, but a high P/E does imply buyers are optimistic about the future.
How Growth Rates Impact P/E Ratios
Generally speaking the rate of earnings growth has a profound impact on a company's P/E multiple. Earnings growth means that in the future the 'E' will be higher. Therefore, even if you pay a high multiple of earnings now, that multiple will become lower in the future. Then, a lower P/E should attract more buyers, pushing the share price up.
Kimball Electronics's 79% EPS improvement over the last year was like bamboo growth after rain; rapid and impressive. Having said that, if we look back three years, EPS growth has averaged a comparatively less impressive 10%.
How Does Kimball Electronics's P/E Ratio Compare To Its Peers?
We can get an indication of market expectations by looking at the P/E ratio. We can see in the image below that the average P/E (21.7) for companies in the electronic industry is higher than Kimball Electronics's P/E.
Kimball Electronics's P/E tells us that market participants think it will not fare as well as its peers in the same industry. Since the market seems unimpressed with Kimball Electronics, it's quite possible it could surprise on the upside. If you consider the stock interesting, further research is recommended. For example, I often monitor director buying and selling.
A Limitation: P/E Ratios Ignore Debt and Cash In The Bank
One drawback of using a P/E ratio is that it considers market capitalization, but not the balance sheet. That means it doesn't take debt or cash into account. The exact same company would hypothetically deserve a higher P/E ratio if it had a strong balance sheet, than if it had a weak one with lots of debt, because a cashed up company can spend on growth.
Such expenditure might be good or bad, in the long term, but the point here is that the balance sheet is not reflected by this ratio.
Kimball Electronics's Balance Sheet
Net debt totals 13% of Kimball Electronics's market cap. This could bring some additional risk, and reduce the number of investment options for management; worth remembering if you compare its P/E to businesses without debt.
The Bottom Line On Kimball Electronics's P/E Ratio
Kimball Electronics trades on a P/E ratio of 14.7, which is below the US market average of 18.2. The company does have a little debt, and EPS growth was good last year. The low P/E ratio suggests current market expectations are muted, implying these levels of growth will not continue.
Investors have an opportunity when market expectations about a stock are wrong. As value investor Benjamin Graham famously said, 'In the short run, the market is a voting machine but in the long run, it is a weighing machine.' We don't have analyst forecasts, but you could get a better understanding of its growth by checking out this more detailed historical graph of earnings, revenue and cash flow.
Of course you might be able to find a better stock than Kimball Electronics. So you may wish to see this freecollection of other companies that have grown earnings strongly.
We aim to bring you long-term focused research analysis driven by fundamental data. Note that our analysis may not factor in the latest price-sensitive company announcements or qualitative material.
If you spot an error that warrants correction, please contact the editor at editorial-team@simplywallst.com. This article by Simply Wall St is general in nature. It does not constitute a recommendation to buy or sell any stock, and does not take account of your objectives, or your financial situation. Simply Wall St has no position in the stocks mentioned. Thank you for reading.
About NasdaqGS:KE
Kimball Electronics
Engages in the provision of electronics manufacturing, engineering, and supply chain support services to customers in the automotive, medical, and industrial end markets.
Flawless balance sheet with limited growth.
Similar Companies
Market Insights


Advertisement
Community Narratives
The Future of Drug Testing? Fingerprint Tech Shows Serious Promise
Fair Value US$2.98|40.3% undervalued
JO
Community Contributor
Suncorp’s Next Chapter: Insurance-Only and Ready to Grow
Fair Value AU$22.83|7.9% undervalued
RO
Community Contributor
Thyssenkrupp Nucera Will Achieve Double-Digit Profits by 2030 Boosted by Hydrogen Growth
Fair Value €14.40|31.6% undervalued
CH
Community Contributor
Tesla’s Nvidia Moment – The AI & Robotics Inflection Point
Fair Value US$359.72|12.3% undervalued
BL
Community Contributor