
Legendary fund manager Li Lu (who Charlie Munger backed) once said, 'The biggest investment risk is not the volatility of prices, but whether you will suffer a permanent loss of capital.' When we think about how risky a company is, we always like to look at its use of debt, since debt overload can lead to ruin. We can see that Genasys Inc. (NASDAQ:GNSS) does use debt in its business. But the real question is whether this debt is making the company risky.
When Is Debt Dangerous?
Debt and other liabilities become risky for a business when it cannot easily fulfill those obligations, either with free cash flow or by raising capital at an attractive price. Ultimately, if the company can't fulfill its legal obligations to repay debt, shareholders could walk away with nothing. However, a more frequent (but still costly) occurrence is where a company must issue shares at bargain-basement prices, permanently diluting shareholders, just to shore up its balance sheet. Of course, plenty of companies use debt to fund growth, without any negative consequences. When we think about a company's use of debt, we first look at cash and debt together.
See our latest analysis for Genasys
How Much Debt Does Genasys Carry?
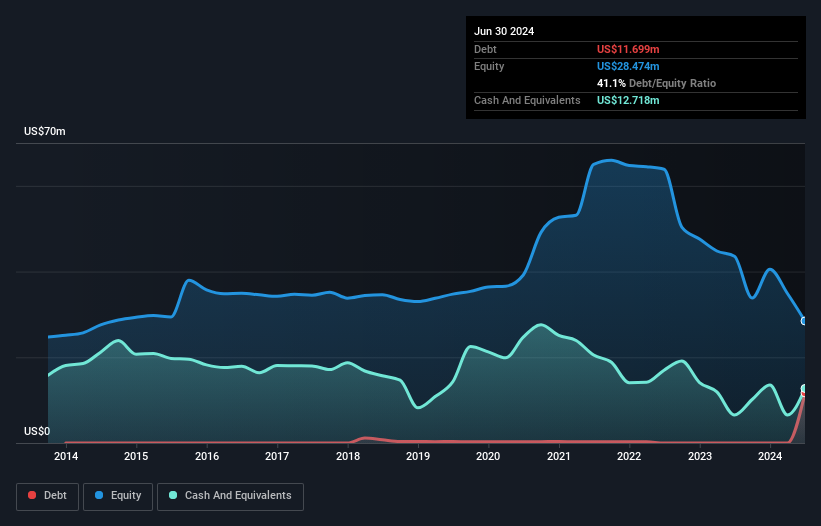
As you can see below, at the end of June 2024, Genasys had US$11.7m of debt, up from none a year ago. Click the image for more detail. But it also has US$12.7m in cash to offset that, meaning it has US$1.02m net cash.
A Look At Genasys' Liabilities
We can see from the most recent balance sheet that Genasys had liabilities of US$12.3m falling due within a year, and liabilities of US$18.7m due beyond that. On the other hand, it had cash of US$12.7m and US$6.23m worth of receivables due within a year. So it has liabilities totalling US$12.0m more than its cash and near-term receivables, combined.
Given Genasys has a market capitalization of US$120.9m, it's hard to believe these liabilities pose much threat. However, we do think it is worth keeping an eye on its balance sheet strength, as it may change over time. While it does have liabilities worth noting, Genasys also has more cash than debt, so we're pretty confident it can manage its debt safely. When analysing debt levels, the balance sheet is the obvious place to start. But it is future earnings, more than anything, that will determine Genasys's ability to maintain a healthy balance sheet going forward. So if you want to see what the professionals think, you might find this free report on analyst profit forecasts to be interesting.
Over 12 months, Genasys made a loss at the EBIT level, and saw its revenue drop to US$28m, which is a fall of 46%. That makes us nervous, to say the least.
So How Risky Is Genasys?
By their very nature companies that are losing money are more risky than those with a long history of profitability. And the fact is that over the last twelve months Genasys lost money at the earnings before interest and tax (EBIT) line. Indeed, in that time it burnt through US$17m of cash and made a loss of US$30m. Given it only has net cash of US$1.02m, the company may need to raise more capital if it doesn't reach break-even soon. Overall, we'd say the stock is a bit risky, and we're usually very cautious until we see positive free cash flow. There's no doubt that we learn most about debt from the balance sheet. But ultimately, every company can contain risks that exist outside of the balance sheet. To that end, you should learn about the 4 warning signs we've spotted with Genasys (including 1 which shouldn't be ignored) .
When all is said and done, sometimes its easier to focus on companies that don't even need debt. Readers can access a list of growth stocks with zero net debt 100% free, right now.
The New Payments ETF Is Live on NASDAQ:
Money is moving to real-time rails, and a newly listed ETF now gives investors direct exposure. Fast settlement. Institutional custody. Simple access.
Explore how this launch could reshape portfolios
Sponsored ContentNew: Manage All Your Stock Portfolios in One Place
We've created the ultimate portfolio companion for stock investors, and it's free.
• Connect an unlimited number of Portfolios and see your total in one currency
• Be alerted to new Warning Signs or Risks via email or mobile
• Track the Fair Value of your stocks
Have feedback on this article? Concerned about the content? Get in touch with us directly. Alternatively, email editorial-team (at) simplywallst.com.
This article by Simply Wall St is general in nature. We provide commentary based on historical data and analyst forecasts only using an unbiased methodology and our articles are not intended to be financial advice. It does not constitute a recommendation to buy or sell any stock, and does not take account of your objectives, or your financial situation. We aim to bring you long-term focused analysis driven by fundamental data. Note that our analysis may not factor in the latest price-sensitive company announcements or qualitative material. Simply Wall St has no position in any stocks mentioned.
About NasdaqCM:GNSS
Genasys
Designs, develops, and sells critical communications hardware and software solutions to alert, inform, and protect people principally in the Asia Pacific, North and South America, Europe, the Middle East, and Africa.
Low risk with worrying balance sheet.
Similar Companies
Market Insights

Weekly Picks

Early mover in a fast growing industry. Likely to experience share price volatility as they scale


A case for CA$31.80 (undiluted), aka 8,616% upside from CA$0.37 (an 86 bagger!).


Moderation and Stabilisation: HOLD: Fair Price based on a 4-year Cycle is $12.08
Recently Updated Narratives


Q3 Outlook modestly optimistic


Title: Market Sentiment Is Dead Wrong — Here's Why PSEC Deserves a Second Look


An amazing opportunity to potentially get a 100 bagger
Popular Narratives


Crazy Undervalued 42 Baggers Silver Play (Active & Running Mine)


NVDA: Expanding AI Demand Will Drive Major Data Center Investments Through 2026


MicroVision will explode future revenue by 380.37% with a vision towards success
Trending Discussion
