Advertisement
- United States
- /
- Electronic Equipment and Components
- /
- NasdaqGS:FLEX
Is Flex (NASDAQ:FLEX) Using Too Much Debt?
David Iben put it well when he said, 'Volatility is not a risk we care about. What we care about is avoiding the permanent loss of capital.' When we think about how risky a company is, we always like to look at its use of debt, since debt overload can lead to ruin. We note that Flex Ltd. (NASDAQ:FLEX) does have debt on its balance sheet. But should shareholders be worried about its use of debt?
Why Does Debt Bring Risk?
Debt and other liabilities become risky for a business when it cannot easily fulfill those obligations, either with free cash flow or by raising capital at an attractive price. Part and parcel of capitalism is the process of 'creative destruction' where failed businesses are mercilessly liquidated by their bankers. However, a more common (but still painful) scenario is that it has to raise new equity capital at a low price, thus permanently diluting shareholders. Of course, debt can be an important tool in businesses, particularly capital heavy businesses. When we examine debt levels, we first consider both cash and debt levels, together.
See our latest analysis for Flex
How Much Debt Does Flex Carry?
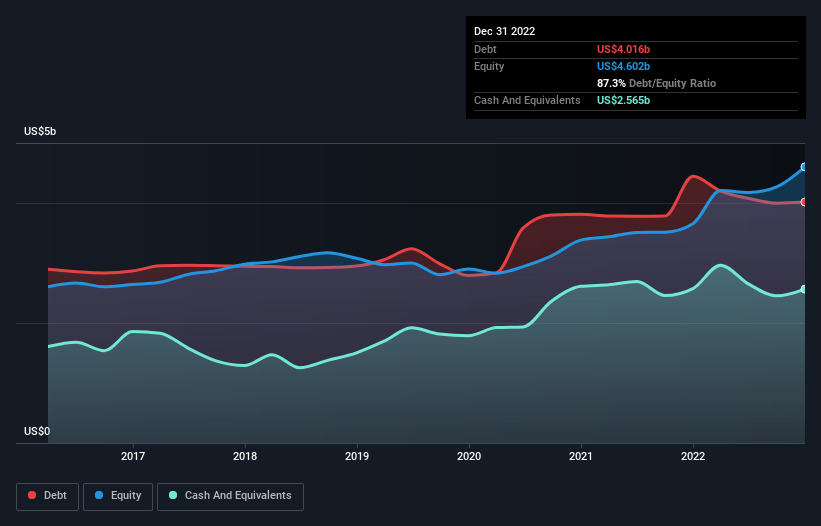
The image below, which you can click on for greater detail, shows that Flex had debt of US$4.02b at the end of December 2022, a reduction from US$4.45b over a year. However, it also had US$2.57b in cash, and so its net debt is US$1.45b.
How Healthy Is Flex's Balance Sheet?
The latest balance sheet data shows that Flex had liabilities of US$11.7b due within a year, and liabilities of US$4.62b falling due after that. On the other hand, it had cash of US$2.57b and US$4.45b worth of receivables due within a year. So its liabilities outweigh the sum of its cash and (near-term) receivables by US$9.27b.
This is a mountain of leverage relative to its market capitalization of US$9.36b. Should its lenders demand that it shore up the balance sheet, shareholders would likely face severe dilution.
We measure a company's debt load relative to its earnings power by looking at its net debt divided by its earnings before interest, tax, depreciation, and amortization (EBITDA) and by calculating how easily its earnings before interest and tax (EBIT) cover its interest expense (interest cover). This way, we consider both the absolute quantum of the debt, as well as the interest rates paid on it.
Flex has net debt of just 0.88 times EBITDA, indicating that it is certainly not a reckless borrower. And this view is supported by the solid interest coverage, with EBIT coming in at 7.1 times the interest expense over the last year. While Flex doesn't seem to have gained much on the EBIT line, at least earnings remain stable for now. When analysing debt levels, the balance sheet is the obvious place to start. But ultimately the future profitability of the business will decide if Flex can strengthen its balance sheet over time. So if you want to see what the professionals think, you might find this free report on analyst profit forecasts to be interesting.
Finally, a business needs free cash flow to pay off debt; accounting profits just don't cut it. So we clearly need to look at whether that EBIT is leading to corresponding free cash flow. Over the last three years, Flex reported free cash flow worth 17% of its EBIT, which is really quite low. That limp level of cash conversion undermines its ability to manage and pay down debt.
Our View
To be frank both Flex's conversion of EBIT to free cash flow and its track record of staying on top of its total liabilities make us rather uncomfortable with its debt levels. But at least it's pretty decent at managing its debt, based on its EBITDA,; that's encouraging. Once we consider all the factors above, together, it seems to us that Flex's debt is making it a bit risky. That's not necessarily a bad thing, but we'd generally feel more comfortable with less leverage. There's no doubt that we learn most about debt from the balance sheet. But ultimately, every company can contain risks that exist outside of the balance sheet. For example, we've discovered 2 warning signs for Flex that you should be aware of before investing here.
When all is said and done, sometimes its easier to focus on companies that don't even need debt. Readers can access a list of growth stocks with zero net debt 100% free, right now.
New: AI Stock Screener & Alerts
Our new AI Stock Screener scans the market every day to uncover opportunities.
• Dividend Powerhouses (3%+ Yield)
• Undervalued Small Caps with Insider Buying
• High growth Tech and AI Companies
Or build your own from over 50 metrics.
Have feedback on this article? Concerned about the content? Get in touch with us directly. Alternatively, email editorial-team (at) simplywallst.com.
This article by Simply Wall St is general in nature. We provide commentary based on historical data and analyst forecasts only using an unbiased methodology and our articles are not intended to be financial advice. It does not constitute a recommendation to buy or sell any stock, and does not take account of your objectives, or your financial situation. We aim to bring you long-term focused analysis driven by fundamental data. Note that our analysis may not factor in the latest price-sensitive company announcements or qualitative material. Simply Wall St has no position in any stocks mentioned.
About NasdaqGS:FLEX
Flex
Provides technology innovation, supply chain, and manufacturing solutions to data center, communications, enterprise, consumer, automotive, industrial, healthcare, industrial, and power industries in the Americas, Asia, and Europe.
Flawless balance sheet with high growth potential.
Similar Companies
Market Insights


Advertisement
Weekly Picks
CE


Ceazar on Conexeu Sciences ·
This small biotech is developing technology that could potentially change how tissue is rebuilt
Fair Value:US$25.3447.6% undervalued
33 followersusers have followed this narrative
0 commentsusers have commented on this narrative
3 likesusers have liked this narrative
HE


HedgeY on Quanta Services ·
The Picks-and-Shovels Leader of the Grid Supercycle
Fair Value:US$7101.1% undervalued
51 followersusers have followed this narrative
0 commentsusers have commented on this narrative
4 likesusers have liked this narrative
FU

FundamentalFlow on Karman Holdings ·
KRMN — Karman Space & Defense: Down 58% from Peak, Is the Market Mispricing a Hypergrowth Defense Compounder?
Fair Value:US$105.652.3% undervalued
28 followersusers have followed this narrative
2 commentsusers have commented on this narrative
13 likesusers have liked this narrative
DO


Double_Bubbler on Invinity Energy Systems ·
Invinity Energy Systems: All About That BESS
Fair Value:UK£162.2% undervalued
38 followersusers have followed this narrative
0 commentsusers have commented on this narrative
6 likesusers have liked this narrative
Recently Updated Narratives
AN


andre_santos on Oracle ·
Oracle - A Fundamental and Historical Valuation
Fair Value:US$192.594.3% undervalued
1 followerusers have followed this narrative
0 commentsusers have commented on this narrative
0 likesusers have liked this narrative
RO


RockeTeller on Maronan Metals ·
Australia’s Next Silver Giant, PEA Delivers A$377M NPV & 37% IRR on Just 22% of Resource
Fair Value:AU$21.1297.6% undervalued
1 followerusers have followed this narrative
0 commentsusers have commented on this narrative
0 likesusers have liked this narrative
RO

RockeTeller on American Resources ·
American Resources, $263M Market Cap + 19% ReElement Stake, From Coal to Critical Minerals
Fair Value:US$557.0% undervalued
5 followersusers have followed this narrative
0 commentsusers have commented on this narrative
0 likesusers have liked this narrative
Popular Narratives
MA


martinarauz on Nu Holdings ·
Investment Analysis (May 2026)
Fair Value:US$22.7444.1% undervalued
67 followersusers have followed this narrative
0 commentsusers have commented on this narrative
16 likesusers have liked this narrative
HA


HarishPK on Adobe ·
Adobe: A Probabilistic Case for Undervaluation
Fair Value:US$319.9639.0% undervalued
59 followersusers have followed this narrative
9 commentsusers have commented on this narrative
17 likesusers have liked this narrative
NI


niteco on Honeywell International ·
Honeywell - The Demand-Side of the AI Infrastructure
Fair Value:US$320.1928.5% undervalued
52 followersusers have followed this narrative
0 commentsusers have commented on this narrative
19 likesusers have liked this narrative

