Advertisement
- United States
- /
- Electronic Equipment and Components
- /
- NasdaqGS:FLEX
Is Flex (FLEX) Now Fairly Priced After Its Strong Multi Year Share Price Run?

Reviewed by Bailey Pemberton
- If you are looking at Flex and wondering whether the current share price lines up with the underlying business, this article will walk through what the numbers actually say about value.
- Flex shares last closed at US$63.98, with returns of 1.5% over 7 days, 4.3% over 30 days, 0.5% year to date and 48.2% over the past year, along with a very large 3 year gain that is around 3.6x and a 5 year gain of around 4.5x.
- Those moves sit against a backdrop of ongoing market interest in electronics manufacturing and supply chain solutions, where investors often weigh contract visibility, customer mix and capital allocation when thinking about value. This context helps explain why sentiment around Flex can shift quickly as new information about industry demand, customer relationships or balance sheet decisions emerges.
- Right now, Flex has a valuation score of 2 out of 6. This means it screens as undervalued on 2 of the 6 checks we will walk through shortly. We will then finish by looking at a more holistic way to think about what that valuation really means for you.
Flex scores just 2/6 on our valuation checks. See what other red flags we found in the full valuation breakdown.
Approach 1: Flex Discounted Cash Flow (DCF) Analysis
A Discounted Cash Flow, or DCF, model takes estimates of the cash a business could generate in the future and discounts those cash flows back to what they may be worth in today's dollars. It is a way of asking what you might reasonably pay now for those future cash streams.
For Flex, the model used here is a 2 Stage Free Cash Flow to Equity approach, based on cash flow projections. The latest twelve month free cash flow is about US$1.16b. Analysts provide specific forecasts for the next few years. Beyond that, Simply Wall St extrapolates, with projected free cash flow of US$1.36b in 2028 and further estimates through 2035.
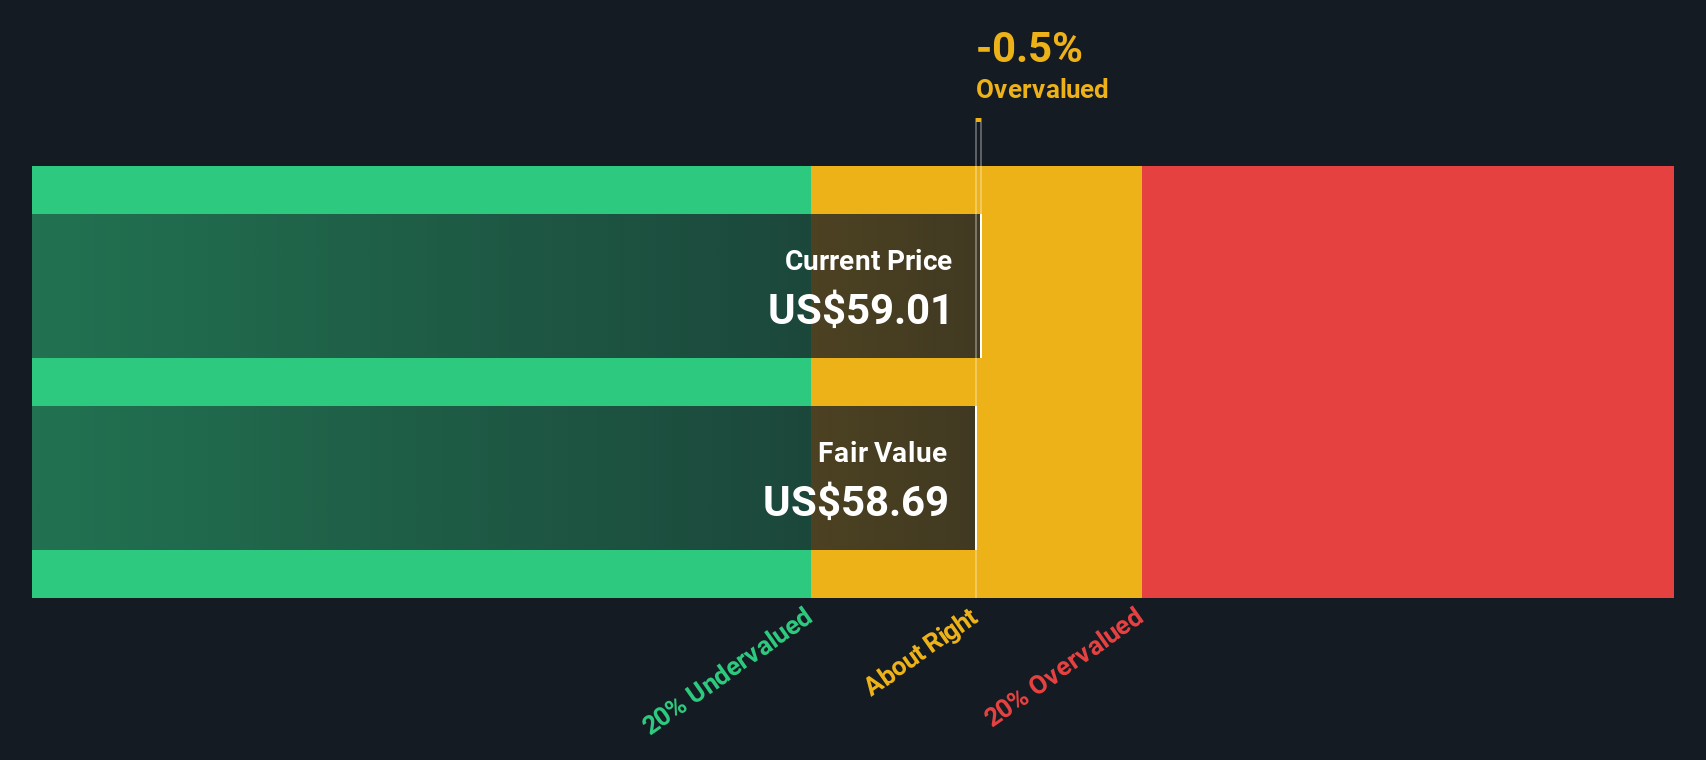
After discounting these projected cash flows back to today, the DCF model arrives at an estimated fair value of around US$62.49 per share. With the recent share price at US$63.98, the model implies the stock is about 2.4% overvalued, which is a very small gap and well within the kind of noise you often see in markets.
Result: ABOUT RIGHT
Flex is fairly valued according to our Discounted Cash Flow (DCF), but this can change at a moment's notice. Track the value in your watchlist or portfolio and be alerted on when to act.
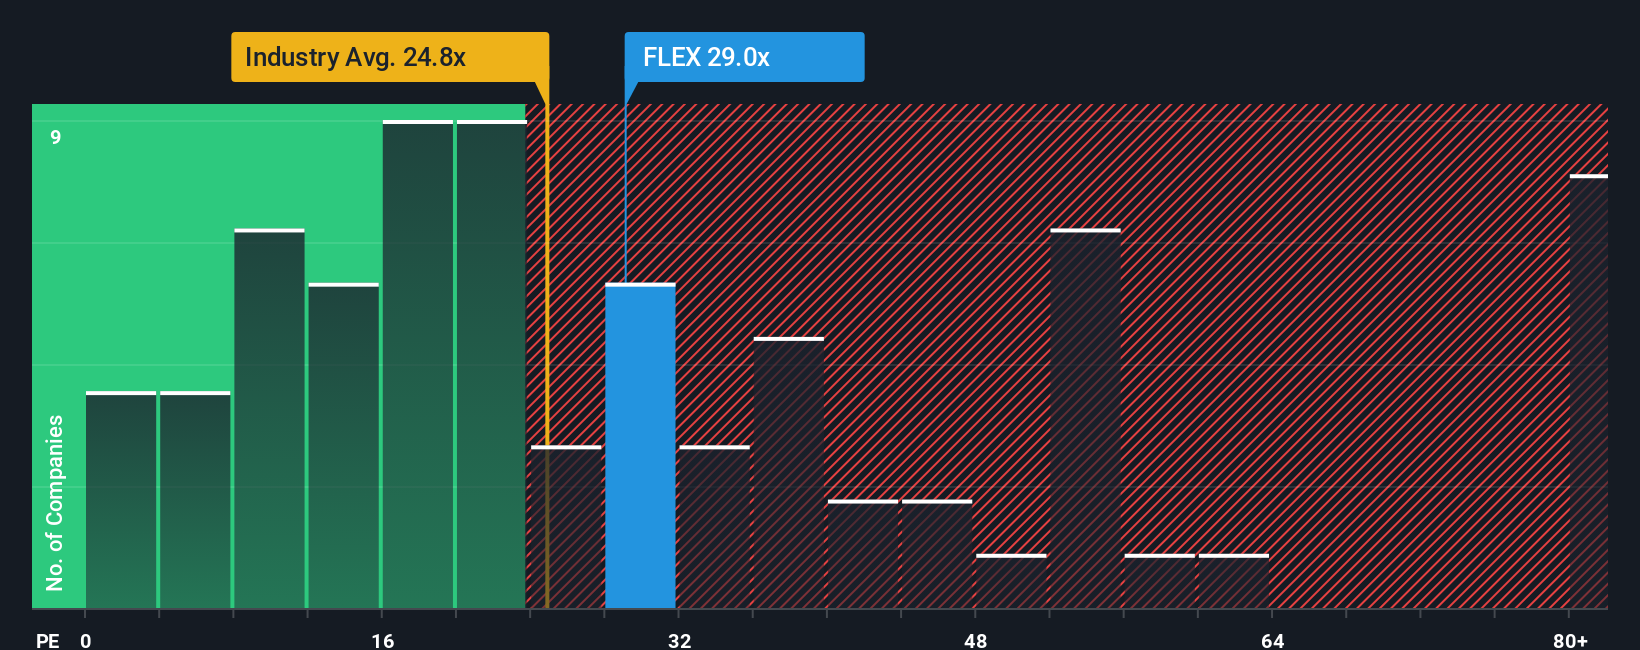
Approach 2: Flex Price vs Earnings
For a profitable business like Flex, the P/E ratio is a useful way to relate what you pay per share to the earnings that each share represents. It gives you a quick sense of how many dollars investors are currently willing to pay for one dollar of earnings.
What counts as a “normal” P/E often reflects how the market sees a company’s growth prospects and risk profile. Higher expected growth or lower perceived risk can justify a higher multiple, while lower expected growth or higher perceived risk usually lines up with a lower multiple.
Flex currently trades on a P/E of 27.77x. That sits close to the Electronic industry average of 27.44x and below the peer group average of 44.90x. Simply Wall St also calculates a proprietary Fair Ratio for Flex of 34.57x, which is the P/E you might expect once factors like earnings growth, profitability, industry, market cap and risk profile are considered together.
This Fair Ratio can be more informative than a simple comparison with peers or the broad industry, because it adjusts for company specific traits rather than assuming all electronics names should trade on the same multiple. With the current P/E below the Fair Ratio, Flex screens as undervalued on this metric.
Result: UNDERVALUED
P/E ratios tell one story, but what if the real opportunity lies elsewhere? Start investing in legacies, not executives. Discover our 22 top founder-led companies.
Upgrade Your Decision Making: Choose your Flex Narrative
Earlier we mentioned that there is an even better way to understand valuation, so let us introduce you to Narratives, a simple way to put a clear story behind your numbers for Flex.
A Narrative is your view of the company translated into assumptions about future revenue, earnings and margins, which then link into a financial forecast and finally into a fair value estimate per share.
On Simply Wall St, millions of investors share these Narratives on the Community page, so you can see different fair values for Flex. You can then compare them with the current share price and use that gap to help decide whether you think it is closer to a buy, a hold or a sell for your own portfolio.
Because Narratives update when new information such as news or earnings is added to the platform, your view of Flex can stay current. For example, one investor might set a much higher fair value than today’s price, while another uses more cautious assumptions and arrives at a much lower figure.
Do you think there's more to the story for Flex? Head over to our Community to see what others are saying!

This article by Simply Wall St is general in nature. We provide commentary based on historical data and analyst forecasts only using an unbiased methodology and our articles are not intended to be financial advice. It does not constitute a recommendation to buy or sell any stock, and does not take account of your objectives, or your financial situation. We aim to bring you long-term focused analysis driven by fundamental data. Note that our analysis may not factor in the latest price-sensitive company announcements or qualitative material. Simply Wall St has no position in any stocks mentioned.
New: AI Stock Screener & Alerts
Our new AI Stock Screener scans the market every day to uncover opportunities.
• Dividend Powerhouses (3%+ Yield)
• Undervalued Small Caps with Insider Buying
• High growth Tech and AI Companies
Or build your own from over 50 metrics.
Have feedback on this article? Concerned about the content? Get in touch with us directly. Alternatively, email editorial-team@simplywallst.com
About NasdaqGS:FLEX
Flex
Provides technology innovation, supply chain, and manufacturing solutions to data center, communications, enterprise, consumer, automotive, industrial, healthcare, industrial, and power industries.
Flawless balance sheet with reasonable growth potential.
Similar Companies
Market Insights


Advertisement
Weekly Picks
ST


stuart_roberts on Upside Gold ·
An Undervalued 3.3Moz Gold Project in Canada
Fair Value:CA$5.0774.4% undervalued
212 followersusers have followed this narrative
1 commentusers have commented on this narrative
30 likesusers have liked this narrative
SI


SimpleMan887 on GameStop ·
GameStop will ace the financial crisis wave with its strategic Bitcoin investment and cash reserves
Fair Value:US$22089.4% undervalued
53 followersusers have followed this narrative
2 commentsusers have commented on this narrative
21 likesusers have liked this narrative
YI

yiannisz on Hesai Group ·
The First Real Lidar Winner
Fair Value:US$27.0716.3% undervalued
14 followersusers have followed this narrative
1 commentusers have commented on this narrative
4 likesusers have liked this narrative
TR


tripledub on Taiwan Semiconductor Manufacturing ·
The Most Wonderful Monopoly in the Most Dangerous Neighbourhood on Earth
Fair Value:US$3812.7% undervalued
10 followersusers have followed this narrative
0 commentsusers have commented on this narrative
11 likesusers have liked this narrative
Recently Updated Narratives
AS


AstrisCorporateAdvisory on INTLOOP ·
Renewed focus on business investment
Fair Value:JP¥4.17k56.4% undervalued
2 followersusers have followed this narrative
0 commentsusers have commented on this narrative
0 likesusers have liked this narrative
GO

GoranLagea on Nova Ljubljanska Banka d.d ·
Nova Ljubljanska Banka d.d. future looks bright with a profit margin change of 38%
Fair Value:€36036.7% undervalued
5 followersusers have followed this narrative
0 commentsusers have commented on this narrative
0 likesusers have liked this narrative
FA

FA_Trader on Fibromat (M) Berhad ·
Fibromat: More than just a niche player, with clearer earnings visibility from order book and project wins
Fair Value:RM 1.0519.5% undervalued
1 followerusers have followed this narrative
0 commentsusers have commented on this narrative
0 likesusers have liked this narrative
Popular Narratives
TR

tripledub on Microsoft ·
Everyone's Terrified Microsoft Will Keep Spending. I'm Terrified They'll Stop.
Fair Value:US$3956.1% undervalued
44 followersusers have followed this narrative
3 commentsusers have commented on this narrative
41 likesusers have liked this narrative
RO


Robbo on Tesla ·
The academically fascinating Tesla
Fair Value:US$301.1k% overvalued
36 followersusers have followed this narrative
11 commentsusers have commented on this narrative
31 likesusers have liked this narrative
AN

AnalystConsensusTarget on Microsoft ·
Analyst Commentary Highlights Microsoft AI Momentum and Upward Valuation Amid Growth and Competitive Risks
Fair Value:US$587.3136.9% undervalued
1350 followersusers have followed this narrative
2 commentsusers have commented on this narrative
11 likesusers have liked this narrative
Trending Discussion

MI

Mikeymike on Auxly Cannabis Group ·
Id like to understand why they believe the profit margin is going decline so dramatically. Is it ene...
0
|0