
Renewable energy stocks made a comeback in 2025 after a challenging couple of years. The catalyst was the billions being invested in datacenters, and the realization that all those GPUs need a lot of power.
Data center operators aren’t fussy about the source of that power, and all options are on the table. Over the last few weeks it’s become apparent that being too dependent on oil and gas might not be a good idea either. We decided it’s time for an update on renewable energy, and the closely related EV sector.
What happened in the markets this week?
Here’s a quick summary of what’s been going on:
🤖 Nvidia adds to its vast web of industry investments with Marvell stake (CNBC)
- What happened: Nvidia invested US$2 billion for a roughly 2.5% stake in Marvell, aligning the company with its NVLink Fusion ecosystem and expanding collaboration across silicon photonics and networking. Marvell’s stock jumped about 13% on heavy volume, while peers like Broadcom also rose and the broader Nasdaq gained.
- How it impacts investors: This strengthens Nvidia’s grip on the AI infrastructure stack while positioning Marvell as a key platform partner, reducing adoption friction for customers. It also signals continued momentum in optical and networking plays tied to AI demand.
- Next steps: Explore AI infrastructure opportunities with the U.S. Data Center (AI Picks and Shovels) screener.
🤖 OpenAI’s US$110B raise boosts AI infrastructure demand visibility (TechCrunch)
- What happened: OpenAI secured a US$110 billion funding round at a US$730 billion valuation, with major backing from Amazon, Nvidia, and SoftBank, though part of the funding includes conditional commitments and services. The deal includes massive compute agreements with AWS and Nvidia, locking in gigawatts of future AI training and inference capacity.
- How it impacts investors: The scale of this deal reinforces long-term demand for cloud infrastructure and AI chips, supporting revenue visibility for hyperscalers and semiconductor firms. It also highlights rising capital intensity and competitive pressure across the AI ecosystem.
- Next steps: Use our global high growth tech & AI screener to spot companies benefiting from this trend:
🕊️ Geopolitical cooling sends oil lower and equities higher (Yahoo Finance)
- What happened: Iran’s president signaled a willingness to end the conflict with the US in talks with EU officials, marking the first public indication of potential de-escalation. Oil prices fell sharply, with Brent and WTI both dropping around 2% to 3%, while US equity markets rallied strongly led by tech stocks.
- How it impacts investors: Markets are beginning to price in a reduced geopolitical risk premium, lifting equities while pressuring energy stocks as oil prices decline. If sustained, this shift could favor consumer, transport, and growth sectors over commodities and defense.
- Next steps: Explore sector rotation opportunities using our global market screener.
👟 Nike’s turnaround doubts deepen as China weakness and guidance rattle markets (CNBC)
- What happened: Nike reported Q3 earnings ahead of expectations, with US$0.35 EPS on US$11.28 billion in revenue, but warned that its turnaround is taking longer than expected. The company projected continued sales declines through the rest of the year, including a roughly 20% drop in China next quarter, sending shares down about 14% and prompting multiple analyst downgrades.
- How it impacts investors: This signals ongoing pressure in global consumer discretionary, especially for brands exposed to China. Investors may need to factor in prolonged margin compression and delayed recovery timelines across the sector.
- Next steps: Have a look at the valuation section of Nike's company report to compare it to its peers.
🚀 SpaceX’s potential record IPO could reset tech valuation benchmarks (Yahoo Finance)
- What happened: SpaceX has confidentially filed for an IPO, targeting a possible June listing that could value the company above US$1.75 trillion and raise up to US$75 billion. The company’s Starlink unit ended 2025 with 9.2 million subscribers and over US$10 billion in revenue, with projections pointing to significant growth into 2026.
- How it impacts investors: A listing of this scale could reshape IPO markets and set new valuation benchmarks for high-growth tech. It may also drive renewed interest and capital flows into space, satellite, and defense-related sectors.
- Next steps: Explore the aerospace and defense sector with the Simply Wall St stock screener.
⚡ Gas turbine prices surge 195% as manufacturers struggle to meet demand (Power Engineering)
- What happened: Gas turbine prices are projected to reach around US$600 per kW by 2027, nearly triple 2019 levels, as demand outpaces limited manufacturing capacity. Orders reached 110 GW by the end of 2025, while supply remains constrained at 60 to 70 GW, with long lead times and production bottlenecks persisting.
- How it impacts investors: Rising power infrastructure costs could benefit turbine manufacturers and suppliers while squeezing margins for energy-intensive industries like data centers. It also highlights how AI-driven electricity demand is reshaping energy investment dynamics.
- Next steps: The U.S. Midstream Oil and Gas Pipeline Operators includes many of the companies supplying power stations.
What’s Happening with EVs and Renewables?
Anyone investing in renewable energy and electric vehicle stocks over the last five years will know it’s been something of a roller coaster.
Most investments made in solar, wind or EV stocks in late 2020 and early 2021 remain under water. And that’s after the recovery in 2025, driven primarily by anticipated AI data center demand.
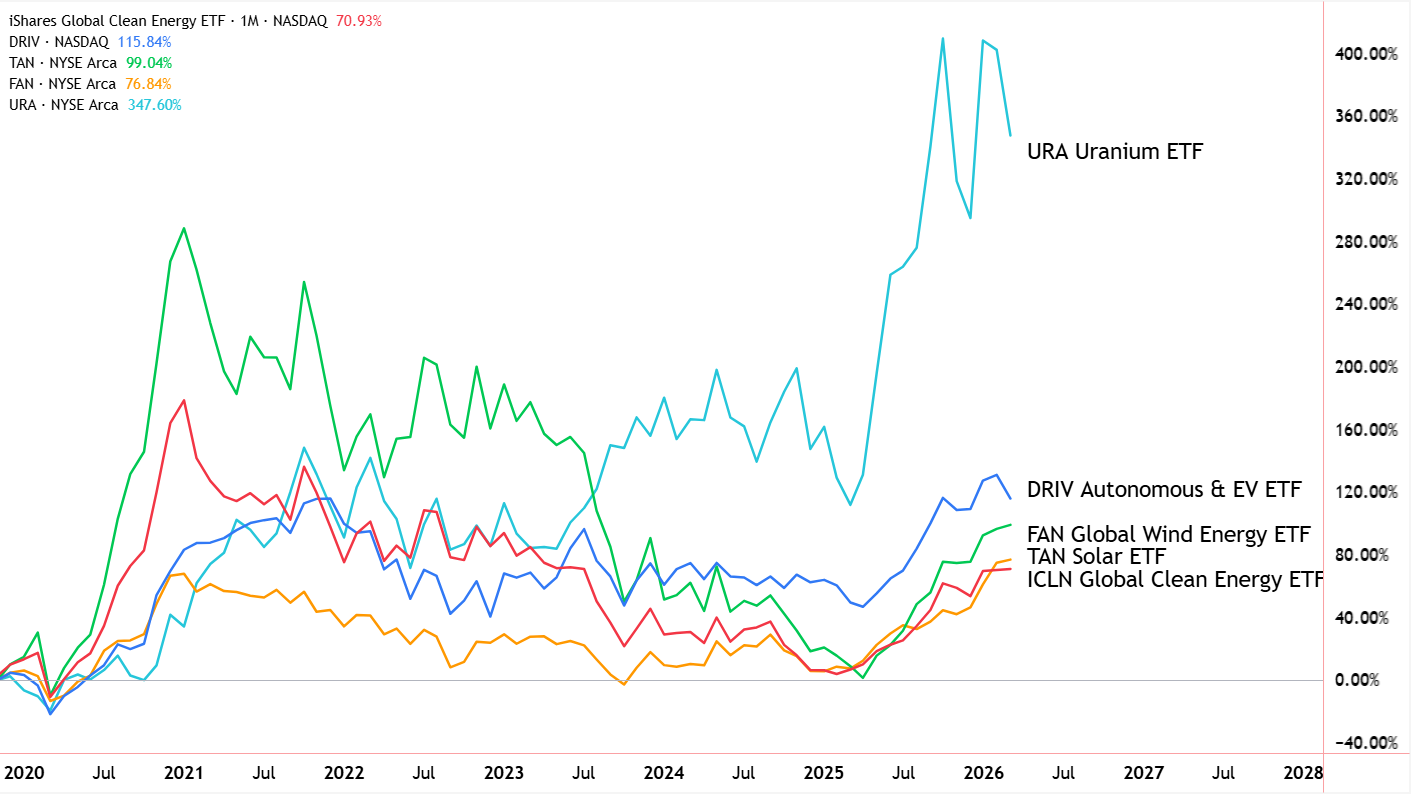
Note: The Global X Autonomous and electric vehicle ETF appears to stack up quite well compared to the solar and wind ETFs. Under the hood, that fund’s largest holdings include Nvidia, Alphabet, Intel and Microsoft. Sure, they supply the industry with components and software, but they aren’t exactly EV companies. ETFs aren’t always what their names suggest.
Judging by the chart above, it may seem like the transition to renewable and cleaner forms of energy has ground to a halt.
In June last year, we took a look at the longer term outlook for the energy transition. TL;DR The odds of reaching net-zero by 2050 aren’t looking promising!
But that doesn’t mean nothing's happening. In fact, a lot is happening. Here are a few stats from 2025 to put things in perspective:
- Global solar and wind installations exceeded 800 GW, tripling the 2021 figure.
- Global EV sales crossed 17 million units, representing more than 20% of all new car sales worldwide.
- An estimated $2.2 trillion was invested in renewable energy, nuclear, grid expansion and low emission fuels.This was double the investments made in oil, gas and coal.
The clean energy transition might be behind schedule, but it remains one of the biggest industrial stories of the last decade.
For individual companies and their shareholders it’s been a lot more complicated.
How it all started
The oversimplified version of events is that low interest rates fueled a speculative bubble, and then inflation and rate hikes brought everything crashing down. But a few other factors created the bubble:
- During the Covid pandemic, interest rates were cut to just about zero.
- Stimulus payments flooded into the economy, at a time when there was little opportunity to spend money.
- Importantly, this was also a period when Tesla’s annual deliveries were approaching 500,000 and annual revenue crossed the $20 billion mark. Investors were eager to catch the next EV success story.
- The price of solar panels had also fallen to a point that made solar power competitive with power generated from fossil fuels.
- Incentives in the form of tax credits and subsidies in the US, Europe and China boosted demand, while reducing costs for consumers and manufacturers.
When it comes to energy, whether it comes from renewables, fossil fuels or nuclear, government policy is always a key factor. Despite the bubble popping in 2021, the Inflation Reduction Act in 2022 gave institutional investors more confidence to invest in renewables, which led to higher rates of investment.
💡 It’s no secret that Joe Biden was supportive of renewables, while Donald Trump is firmly against them. Yet, the highs on the chart above were recorded within weeks of Biden’s inauguration, and the lows occurred within weeks of Trump’s inauguration. A reminder that share prices tend to peak when optimism peaks, and lows are also formed when pessimism is greatest.
Five years ago, any stock with EV, solar or wind in its name, seemed to go one way: up.
Since then things have become far more company and country specific. Policy and trade barriers have played a role, but business models and innovation have also separated the winners from the losers.
Here’s where they’re all at now
Electric vehicles: China takes the lead
During the height of EV mania, the ‘hot stocks’ were Rivian, Lucid , Nio , XPeng, and a few that have since gone belly up.
Take a look at global EV market share now, and those names don’t even feature.
Electric vehicle manufacturing is expensive and it helps to have existing infrastructure, distribution and capital in place.
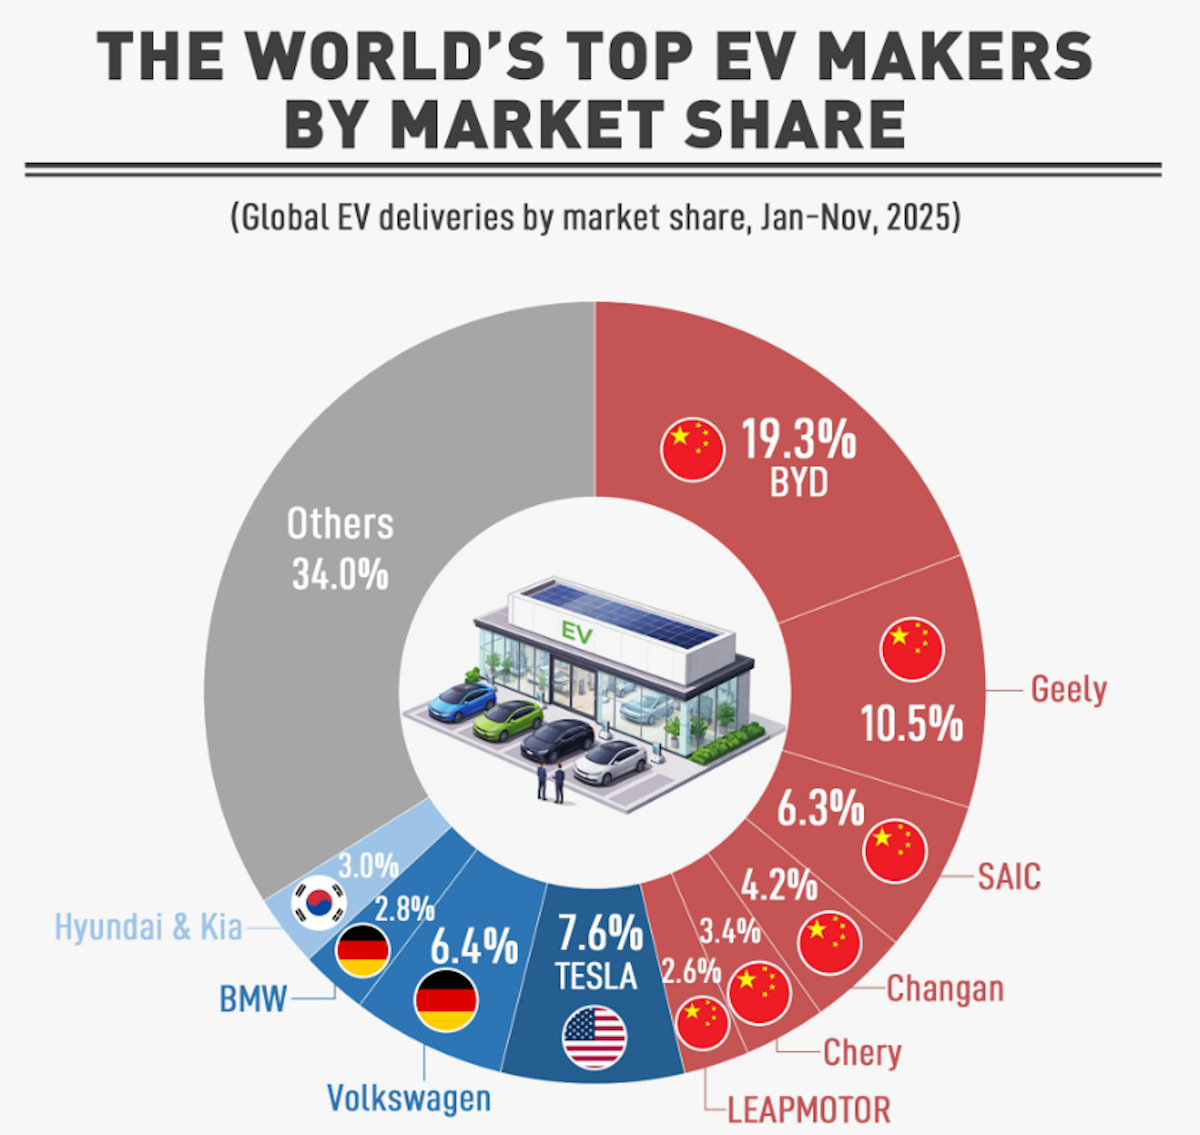
As you can see, Chinese manufacturers are still winning the EV race despite them being different names from five years ago.
Ultimately, Chinese manufacturers' ability to cut costs (with help from government subsidies too) has seen them emerge as the winners. BYD’s vertical integration and focus on cost effective Lithium Iron Phosphate batteries helped the company outpace Tesla in 2024. BYD also sells hybrid electric vehicles which opens up a wider market.
Two-thirds of Chinese EVs are already priced below their conventional equivalents. By contrast, in Europe and the US, EVs are still 20 to 30% more expensive than comparable petrol cars.
Solar and wind: It’s all about the business model
Donald Trump’s One Big Beautiful Bill Act (OBBBA) unfortunately moved to eliminate multiple incentives for consumers buying EVs and installing residential solar panels.
In addition to that, elevated interest rates had sealed the fate for many companies in the solar and wind space as raising and borrowing cash became more expensive. This has been the case in the U.S. and Europe.
Companies installing residential solar in particular, which they tend to also get financing for, have little chance of making a profit. Independent power producers have also seen their margins shrink since interest rates increased. And that was before tariffs were added to their input costs.
In Europe, Orsted, which owns and operates wind and solar farms, booked a €1.6 billion impairment charge in 2025 after fixed price contracts were wiped out by higher financing costs.
Meanwhile, companies manufacturing and installing wind turbines, solar panels and other equipment for large scale installations have fared far better. Examples include:
- Vestas Wind Systems, a leading manufacture of wind turbines
- First Solar, one of the few Western solar manufacturers with proprietary technology
- Bloom Energy, supplying fuel cells to the data center market.
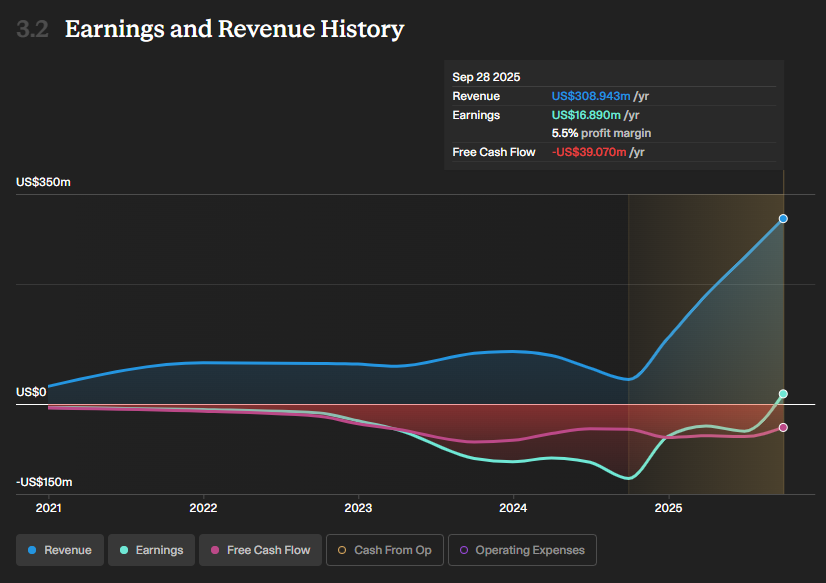
SunPower’s rebirth with a new business model shows the difference being in the right market segment can make. The company, which originally served the residential market, filed for bankruptcy in 2024. It was then recapitalized and pivoted to the commercial market, and became profitable within 18 months.
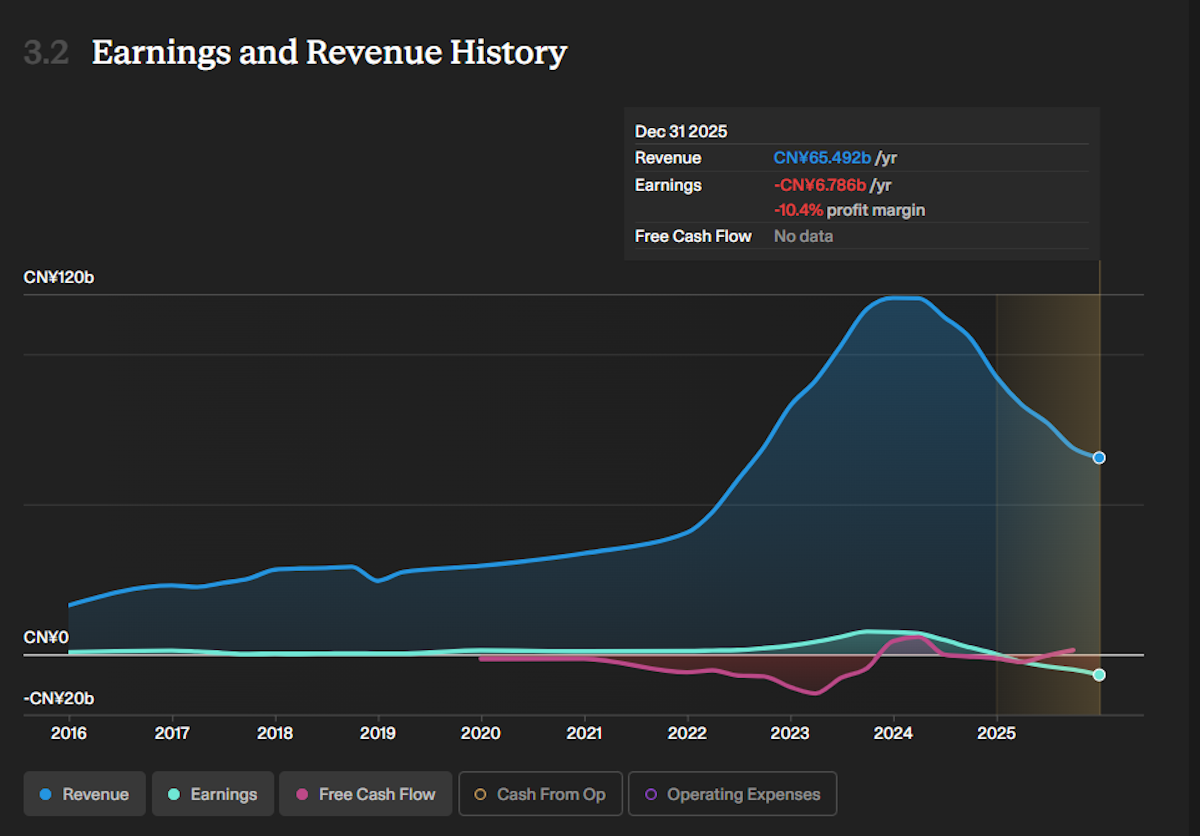
Meanwhile in China, the companies supplying the world with cheap solar panels have become a victim of their own success.
In 2024, annual solar panel production reached 500 GW, nearly twice its domestic demand. This resulted in a price war, which was made worse by new EU and U.S. import tariffs, and the removal of export rebates by the Chinese government.
Jinko Solar’s revenue chart (below) mirrors that of the other leading manufacturers.
💡 The Insight: one size doesn't fit all
Growing energy demand from data centers and the current crisis in the Persian Gulf suggest that renewables do still have a place in the energy mix, and in investors' portfolios.
But the lesson from the hype and fall of renewable stocks in the last few years is that investors need to assess each company on its own merits, and make sure they understand the business model and whether or not the company has a sustainable edge in the market.
The winners of the last few years have been the leaders in their respective industries, with proprietary technology and economies of scale. They also have business models that weren’t over-exposed to financing costs.
This is another reason to be careful about relying on ETFs for exposure to a theme or secular trend. Sure, you’ll own the winners, but you’ll also end up exposed to many of the losers.
It’s also worth looking out for the companies that supply the multiple industries, as they’re the infrastructure behind the entire sector.
One example in the EV space is Borg Warner, a supplier of drivetrains and battery and charging systems used in combustion, hybrid, and electric vehicles. Regardless of who sells the most vehicles, many will have components made by Borg Warner.
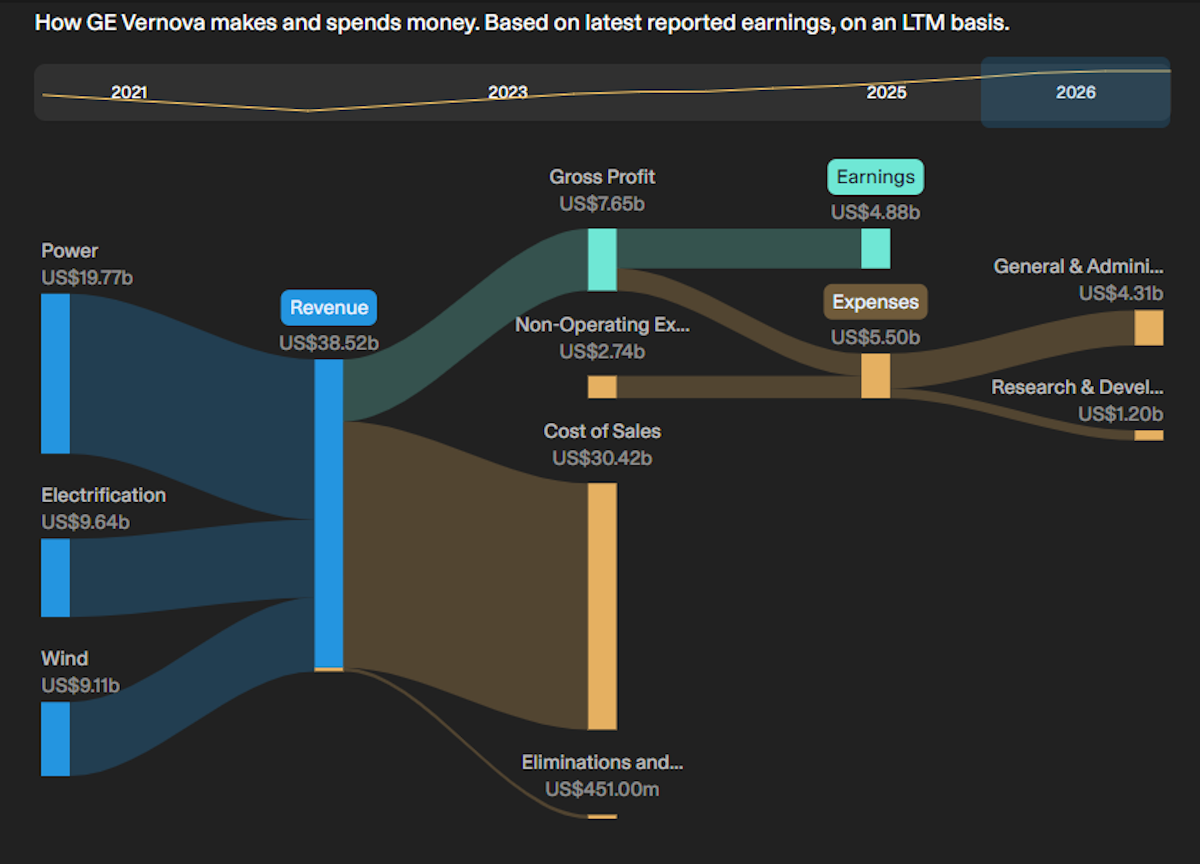
Another in the broader power generation market is GE Verona which supplies technology used for gas, nuclear, hydro, and wind generation, as well as grid and electrification equipment. From 2021 to 2025, the company’s revenue from the wind segment actually fell. But this was more than offset by the power and electrification segments which grew 17 and 73% respectively.
Key Events Next Week
Monday
- 🇺🇸 ISM Services PMI
- 📉Forecast: 54 Previous 56.1
- ➡️ Why it matters: Will confirm (or disprove) economists’ expectations for softer demand.
Wednesday
- 🇺🇸 US FOMC Minutes (March meeting)
- ➡️ Why it matters: The minutes will be scrutinised to see how close the committee was to a hawkish surprise, and whether the Iran conflict and oil shock changed internal rate-cut timelines.
Thursday
- 🇺🇸 US Initial Jobless Claims (Week ending Apr 5)
- 📉 Forecast: 215,000 Previous: 210,000
- ➡️ Why it matters: Claims have held near cycle lows — a surprise rise above 230K would be a sign that layoffs are accelerating, shifting the Fed's calculus on cuts.
Friday
-
🇺🇸 US CPI YoY
- 📈 Forecast: 3.1% Previous: 2.4%
- ➡️ Why it matters: Any re-acceleration toward 3% would validate the Fed's upgraded inflation forecasts and further delay easing.
-
CA Canada Unemployment Rate
- 📈 Forecast: 6.9% Previous: 6.7%
- ➡️ Why it matters: Economists expect to see a rebound in unemployment after six months of improvement.
Have feedback on this article? Concerned about the content? Get in touch with us directly. Alternatively, email editorial-team@simplywallst.com
Simply Wall St analyst Richard Bowman and Simply Wall St have no position in any of the companies mentioned. This article is general in nature. Any comments below from SWS employees are their opinions only, should not be taken as financial advice and may not represent the views of Simply Wall St. Unless otherwise advised, SWS employees providing commentary do not own a position in any company mentioned in the article or in their comments.We provide analysis based on historical data and analyst forecasts only using an unbiased methodology and our articles are not intended to be financial advice. It does not constitute a recommendation to buy or sell any stock and does not take account of your objectives, or your financial situation. We aim to bring you long-term focused analysis driven by fundamental data. Note that our analysis may not factor in the latest price-sensitive company announcements or qualitative material.
Richard Bowman
Richard is an analyst, writer and investor based in Cape Town, South Africa. He has written for several online investment publications and continues to do so. Richard is fascinated by economics, financial markets and behavioral finance. He is also passionate about tools and content that make investing accessible to everyone.
