Advertisement
- United States
- /
- Electronic Equipment and Components
- /
- NasdaqGS:FLEX
Flex (FLEX) Q3 EPS Beat Tests Bearish Margin Concerns
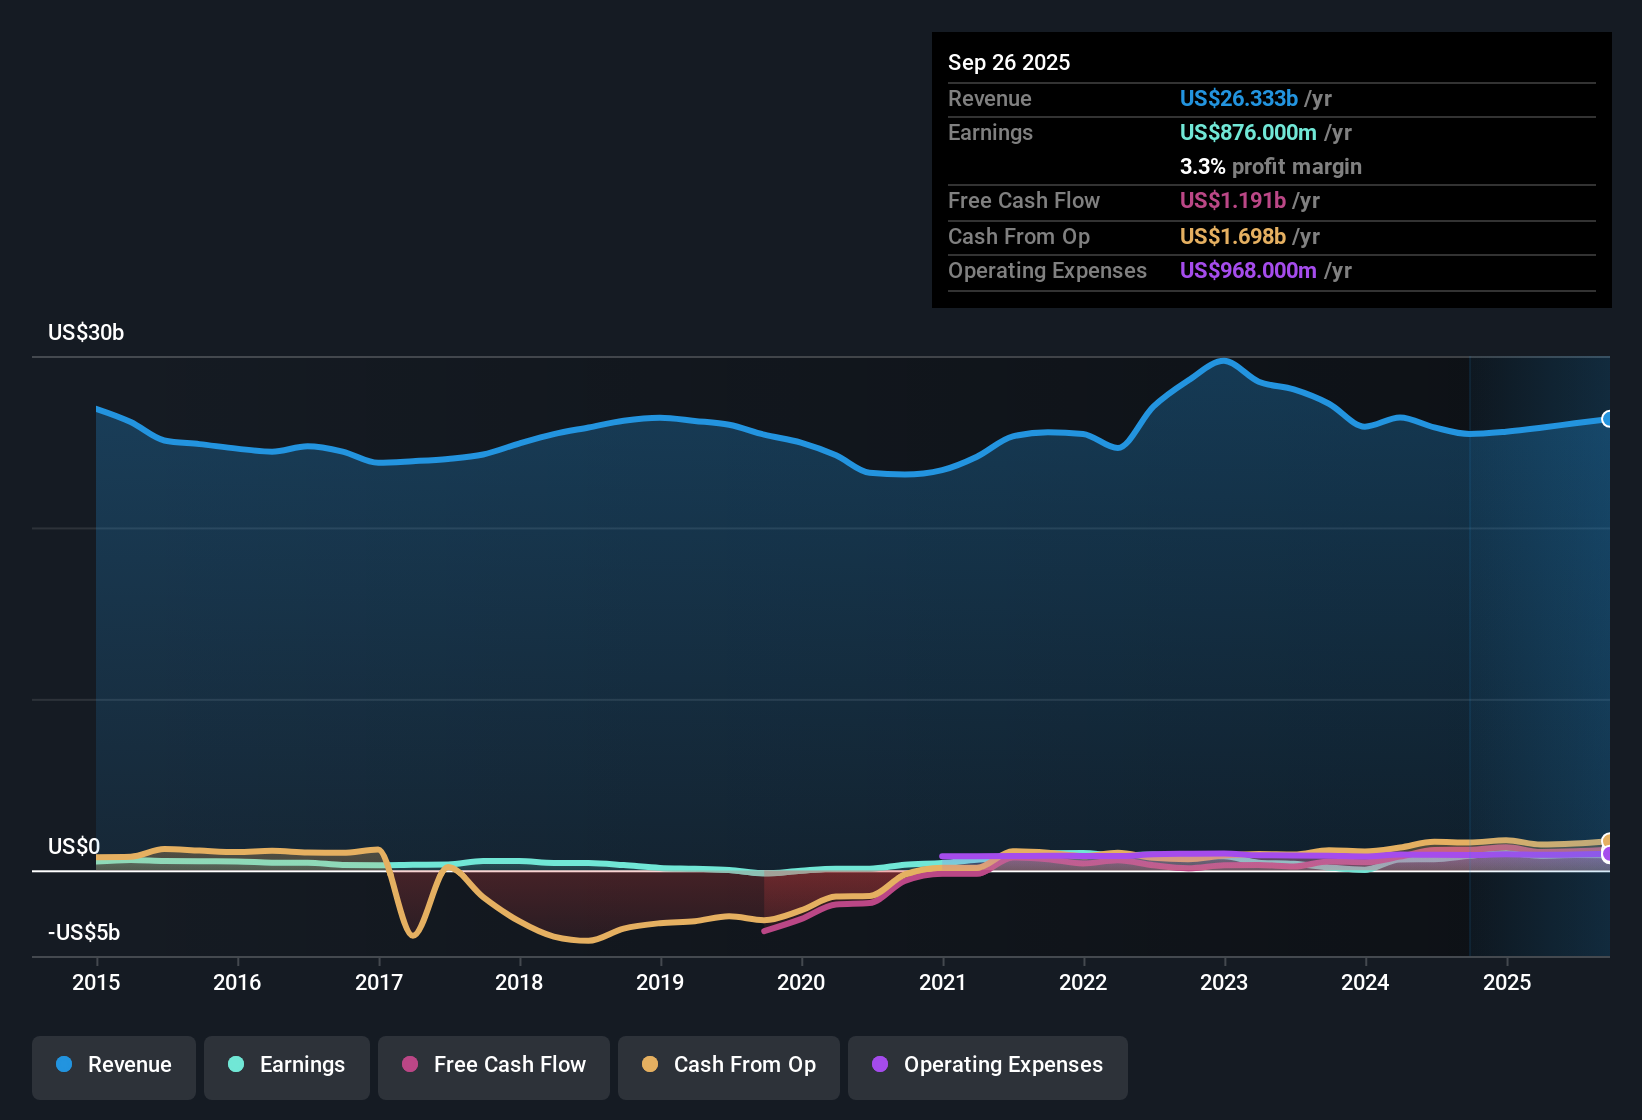
Flex (FLEX) has just reported Q3 2026 results with revenue of US$7.1b and basic EPS of US$0.64, alongside net income excluding extraordinary items of US$239m, setting a clear earnings season marker for the contract manufacturing group. The company has seen quarterly revenue move from US$6.6b in Q2 2026 and US$6.6b in Q1 2026 to the current US$7.1b. EPS has tracked from US$0.51 in Q1 and US$0.53 in Q2 to US$0.64 in Q3, giving investors a fresh read on how profit per share is tracking against a backdrop of relatively thin margins.
See our full analysis for Flex.With the headline numbers on the table, the next step is to set these results against the widely followed Flex narratives to see where the growth story aligns with expectations and where margin trends may be telling a different story.
Curious how numbers become stories that shape markets? Explore Community Narratives
3.2% Net Margin Leaves Little Cushion
- On a trailing 12 month basis, Flex converted US$26.8b of revenue into US$852m of net income, which works out to a 3.2% net margin compared with 4.0% a year earlier.
- Critics highlight that a lower margin business can be sensitive to cost pressure, and the move from a 4.0% net margin to 3.2% shows how small changes in pricing or costs can matter a lot when revenue is roughly US$26.8b.
- At the same time, quarterly net income excluding extra items has held in the US$192m to US$239m range over the last five reported quarters, which may challenge a very bearish view that profitability is collapsing.
- For you as an investor, the key tension is that the business is still earning hundreds of millions of dollars of profit each year, but on thinner margins than the 4.0% level seen a year ago.
Earnings Forecasts Outpace 6.6% Revenue Growth
- Revenue is forecast to grow around 6.6% per year while earnings are expected to rise about 22.5% per year over the next three years, with the latest trailing EPS at US$2.28 on US$26.8b of revenue and US$852m of net income.
- What is surprising for a bullish view is that the strong earnings forecast sits on top of relatively modest expected revenue growth. This means the story depends on Flex doing more with each dollar of sales rather than relying on rapid top line expansion.
- Supporters of the bullish case can point to recent quarterly EPS moving from US$0.51 and US$0.53 in Q1 and Q2 2026 to about US$0.64 in Q3 as evidence that profit per share is already higher than earlier in the year.
- On the other hand, with forecast revenue growth below the broader US market at 6.6% vs 10.1%, any further squeeze in the 3.2% net margin could challenge the idea that earnings can keep growing that quickly.
P/E Of 25.5x And US$58.83 Price
- With the share price at US$58.83, Flex trades on a 25.5x P/E, below the peer average of 46.4x and the industry average of 27.5x, and modestly under a DCF fair value of about US$61.05 while analysts reference a target of US$74.32, which is higher than the current price.
- Supporters of the bullish narrative argue that the combination of relative valuation and forecasts gives some room for upside, but the numbers also show clear guardrails that you should factor in.
- The gap between the current US$58.83 price and the US$61.05 DCF fair value is small compared with the difference between the current price and the US$74.32 analyst target. This means a lot of the bullish case rests on those stronger earnings forecasts playing out.
- At the same time, the P/E discount to peers and industry sits next to the 3.2% trailing net margin and slower forecast revenue growth, so you can read the valuation as the market weighing those risks against the higher earnings growth outlook.
Next Steps
Don't just look at this quarter; the real story is in the long-term trend. We've done an in-depth analysis on Flex's growth and its valuation to see if today's price is a bargain. Add the company to your watchlist or portfolio now so you don't miss the next big move.
See What Else Is Out There
Flex is pairing a 3.2% net margin with forecast revenue growth below the wider US market, which leaves limited room if costs or pricing shift.
If you want businesses where steadier expansion does more of the heavy lifting, check out CTA_SCREENER_STABLE_GROWTH to focus on companies with more consistent revenue and earnings progress.
This article by Simply Wall St is general in nature. We provide commentary based on historical data and analyst forecasts only using an unbiased methodology and our articles are not intended to be financial advice. It does not constitute a recommendation to buy or sell any stock, and does not take account of your objectives, or your financial situation. We aim to bring you long-term focused analysis driven by fundamental data. Note that our analysis may not factor in the latest price-sensitive company announcements or qualitative material. Simply Wall St has no position in any stocks mentioned.
New: AI Stock Screener & Alerts
Our new AI Stock Screener scans the market every day to uncover opportunities.
• Dividend Powerhouses (3%+ Yield)
• Undervalued Small Caps with Insider Buying
• High growth Tech and AI Companies
Or build your own from over 50 metrics.
Have feedback on this article? Concerned about the content? Get in touch with us directly. Alternatively, email editorial-team@simplywallst.com
About NasdaqGS:FLEX
Flex
Provides technology innovation, supply chain, and manufacturing solutions to data center, communications, enterprise, consumer, automotive, industrial, healthcare, industrial, and power industries.
Flawless balance sheet and undervalued.
Similar Companies
Market Insights


Advertisement
Weekly Picks
ST


stuart_roberts on Upside Gold ·
An Undervalued 3.3Moz Gold Project in Canada
Fair Value:CA$5.0776.3% undervalued
82 followersusers have followed this narrative
0 commentsusers have commented on this narrative
14 likesusers have liked this narrative
YA

Yang_ on SoFi Technologies ·
SoFi Technologies: The Apex Aggregator and the Infrastructure of the Modern Financial System
Fair Value:US$22.9820.4% undervalued
3 followersusers have followed this narrative
0 commentsusers have commented on this narrative
1 likeusers have liked this narrative
KO

Kouj on CSL ·
CSL: The Dip Is the Opportunity
Fair Value:AU$1556.7% undervalued
3 followersusers have followed this narrative
0 commentsusers have commented on this narrative
1 likeusers have liked this narrative
GA

GavrielH on DHT Holdings ·
DHT Holdings, inc: Strait of Hormuz Risk Amidst US-Israel vs Iran Tensions Spikes VLCC Rates.
Fair Value:US$3648.3% undervalued
2 followersusers have followed this narrative
0 commentsusers have commented on this narrative
2 likesusers have liked this narrative
Recently Updated Narratives
VE


Vestra on UiPath ·
UiPath Inc. (PATH): Agentic AI Pivot and Milestone Profits Set the Stage for Q4 Results
Fair Value:US$19.6841.1% undervalued
1 followerusers have followed this narrative
0 commentsusers have commented on this narrative
0 likesusers have liked this narrative
VE

Vestra on AeroVironment ·
AeroVironment (AVAV): Q3 Earnings Miss Balanced by Record Backlog and BlueHalo Integration
Fair Value:US$28722.8% undervalued
1 followerusers have followed this narrative
0 commentsusers have commented on this narrative
0 likesusers have liked this narrative
VE

Vestra on Franco-Nevada ·
Franco-Nevada Corporation (TSX: FNV): Premier Streaming Moat Braces for Q4 Results as Diversification Strategy Accelerates
Fair Value:CA$43217.4% undervalued
1 followerusers have followed this narrative
0 commentsusers have commented on this narrative
0 likesusers have liked this narrative
Popular Narratives
KA

kabz2342 on Nu Holdings ·
Nu holdings will continue to disrupt the South American banking market
Fair Value:US$64.376.9% undervalued
51 followersusers have followed this narrative
3 commentsusers have commented on this narrative
27 likesusers have liked this narrative
AN


AnalystConsensusTarget on Microsoft ·
Analyst Commentary Highlights Microsoft AI Momentum and Upward Valuation Amid Growth and Competitive Risks
Fair Value:US$59631.9% undervalued
1306 followersusers have followed this narrative
2 commentsusers have commented on this narrative
10 likesusers have liked this narrative
AN

AnalystConsensusTarget on NVIDIA ·
NVDA: Expanding AI Demand Will Drive Major Data Center Investments Through 2026
Fair Value:US$253.0227.0% undervalued
1102 followersusers have followed this narrative
7 commentsusers have commented on this narrative
34 likesusers have liked this narrative

