
Advertisement
- United States
- /
- Communications
- /
- NasdaqGS:FFIV
Estimating The Intrinsic Value Of F5 Networks, Inc. (NASDAQ:FFIV)

Want to participate in a short research study? Help shape the future of investing tools and receive a $20 prize!
In this article I am going to calculate the intrinsic value of F5 Networks, Inc. (NASDAQ:FFIV) by projecting its future cash flows and then discounting them to today's value. I will use the discounted cash flows (DCF) model. It may sound complicated, but actually it is quite simple! Anyone interested in learning a bit more about intrinsic value should have a read of the Simply Wall St analysis model. If you are reading this and its not February 2019 then I highly recommend you check out the latest calculation for F5 Networks by following the link below.
View our latest analysis for F5 Networks
The method
I use what is known as a 2-stage model, which simply means we have two different periods of varying growth rates for the company's cash flows. Generally the first stage is higher growth, and the second stage is a more stable growth phase. To start off with we need to estimate the next five years of cash flows. For this I used the consensus of the analysts covering the stock, as you can see below. I then discount the sum of these cash flows to arrive at a present value estimate.
5-year cash flow estimate
| 2019 | 2020 | 2021 | 2022 | 2023 | |
| Levered FCF ($, Millions) | $700.81 | $734.34 | $807.00 | $855.93 | $907.82 |
| Source | Analyst x7 | Analyst x8 | Analyst x3 | Est @ 6.06% | Est @ 6.06% |
| Present Value Discounted @ 10.24% | $635.73 | $604.28 | $602.40 | $579.59 | $557.64 |
Present Value of 5-year Cash Flow (PVCF)= US$3.0b
We now need to calculate the Terminal Value, which accounts for all the future cash flows after the five years. The Gordon Growth formula is used to calculate Terminal Value at an annual growth rate equal to the 10-year government bond rate of 2.7%. We discount this to today's value at a cost of equity of 10.2%.
Terminal Value (TV) = FCF2023 × (1 + g) ÷ (r – g) = US$908m × (1 + 2.7%) ÷ (10.2% – 2.7%) = US$12b
Present Value of Terminal Value (PVTV) = TV / (1 + r)5 = US$12b ÷ ( 1 + 10.2%)5 = US$7.6b
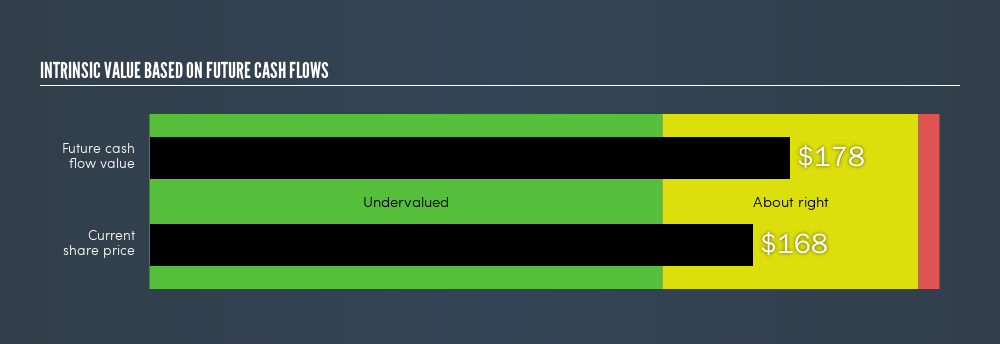
The total value, or equity value, is then the sum of the present value of the cash flows, which in this case is US$11b. In the final step we divide the equity value by the number of shares outstanding. If the stock is an depositary receipt (represents a specified number of shares in a foreign corporation) or ADR then we use the equivalent number. This results in an intrinsic value of $178.5. Compared to the current share price of $168.18, the stock is about right, perhaps slightly undervalued at a 5.8% discount to what it is available for right now.
The assumptions
I'd like to point out that the most important inputs to a discounted cash flow are the discount rate and of course the actual cash flows. If you don't agree with my result, have a go at the calculation yourself and play with the assumptions. Because we are looking at F5 Networks as potential shareholders, the cost of equity is used as the discount rate, rather than the cost of capital (or weighed average cost of capital, WACC) which accounts for debt. In this calculation I've used 10.2%, which is based on a levered beta of 1.033. This is derived from the Bottom-Up Beta method based on comparable companies, with an imposed limit between 0.8 and 2.0, which is a reasonable range for a stable business.
Next Steps:
Although the valuation of a company is important, it shouldn’t be the only metric you look at when researching a company. For FFIV, I've compiled three key factors you should further examine:
- Financial Health: Does FFIV have a healthy balance sheet? Take a look at our free balance sheet analysis with six simple checks on key factors like leverage and risk.
- Future Earnings: How does FFIV's growth rate compare to its peers and the wider market? Dig deeper into the analyst consensus number for the upcoming years by interacting with our free analyst growth expectation chart.
- Other High Quality Alternatives: Are there other high quality stocks you could be holding instead of FFIV? Explore our interactive list of high quality stocks to get an idea of what else is out there you may be missing!
PS. Simply Wall St does a DCF calculation for every US stock every 6 hours, so if you want to find the intrinsic value of any other stock just search here.
We aim to bring you long-term focused research analysis driven by fundamental data. Note that our analysis may not factor in the latest price-sensitive company announcements or qualitative material.
If you spot an error that warrants correction, please contact the editor at editorial-team@simplywallst.com. This article by Simply Wall St is general in nature. It does not constitute a recommendation to buy or sell any stock, and does not take account of your objectives, or your financial situation. Simply Wall St has no position in the stocks mentioned. Thank you for reading.
About NasdaqGS:FFIV
F5
Provides multicloud application security and delivery solutions in the United States, Europe, the Middle East, Africa, and the Asia Pacific region.
Flawless balance sheet with proven track record.
Similar Companies
Market Insights


Advertisement
Community Narratives
For the Emperor: Why Games Workshop Could Be a Star Investment
Fair Value UK£160.00|0.4% undervalued
RO
Community Contributor
Securitas will boost margins with AI and tech-driven services
Fair Value SEK 260.91|45.0% undervalued
UN
Community Contributor
A Leader in EV Charging with Growth Potential
Fair Value €27.00|20.4% undervalued
TI
Community Contributor