- United States
- /
- Electronic Equipment and Components
- /
- NasdaqGS:CGNX
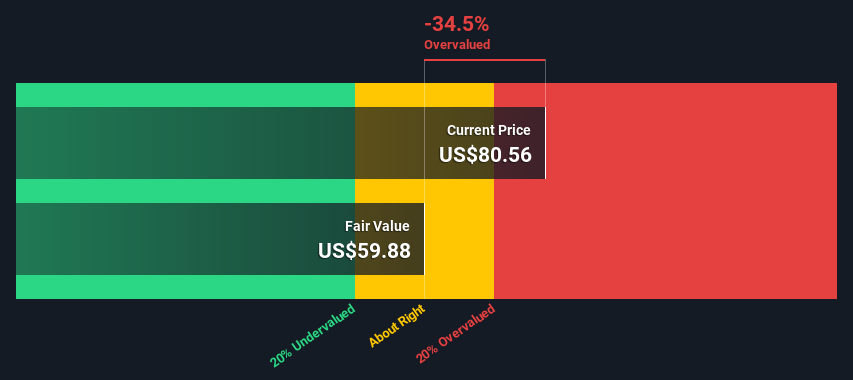
Is Cognex Corporation (NASDAQ:CGNX) Worth US$80.6 Based On Its Intrinsic Value?

How far off is Cognex Corporation (NASDAQ:CGNX) from its intrinsic value? Using the most recent financial data, we'll take a look at whether the stock is fairly priced by estimating the company's future cash flows and discounting them to their present value. One way to achieve this is by employing the Discounted Cash Flow (DCF) model. There's really not all that much to it, even though it might appear quite complex.
We would caution that there are many ways of valuing a company and, like the DCF, each technique has advantages and disadvantages in certain scenarios. If you still have some burning questions about this type of valuation, take a look at the Simply Wall St analysis model.
Check out our latest analysis for Cognex
The method
We use what is known as a 2-stage model, which simply means we have two different periods of growth rates for the company's cash flows. Generally the first stage is higher growth, and the second stage is a lower growth phase. To begin with, we have to get estimates of the next ten years of cash flows. Where possible we use analyst estimates, but when these aren't available we extrapolate the previous free cash flow (FCF) from the last estimate or reported value. We assume companies with shrinking free cash flow will slow their rate of shrinkage, and that companies with growing free cash flow will see their growth rate slow, over this period. We do this to reflect that growth tends to slow more in the early years than it does in later years.
A DCF is all about the idea that a dollar in the future is less valuable than a dollar today, and so the sum of these future cash flows is then discounted to today's value:
10-year free cash flow (FCF) estimate
| 2022 | 2023 | 2024 | 2025 | 2026 | 2027 | 2028 | 2029 | 2030 | 2031 | |
| Levered FCF ($, Millions) | US$326.4m | US$376.5m | US$444.0m | US$493.5m | US$535.0m | US$569.6m | US$598.7m | US$623.6m | US$645.5m | US$665.1m |
| Growth Rate Estimate Source | Analyst x8 | Analyst x7 | Analyst x1 | Est @ 11.16% | Est @ 8.4% | Est @ 6.47% | Est @ 5.11% | Est @ 4.17% | Est @ 3.51% | Est @ 3.04% |
| Present Value ($, Millions) Discounted @ 6.9% | US$305 | US$329 | US$363 | US$378 | US$383 | US$381 | US$375 | US$365 | US$354 | US$341 |
("Est" = FCF growth rate estimated by Simply Wall St)
Present Value of 10-year Cash Flow (PVCF) = US$3.6b
The second stage is also known as Terminal Value, this is the business's cash flow after the first stage. The Gordon Growth formula is used to calculate Terminal Value at a future annual growth rate equal to the 5-year average of the 10-year government bond yield of 2.0%. We discount the terminal cash flows to today's value at a cost of equity of 6.9%.
Terminal Value (TV)= FCF2031 × (1 + g) ÷ (r – g) = US$665m× (1 + 2.0%) ÷ (6.9%– 2.0%) = US$14b
Present Value of Terminal Value (PVTV)= TV / (1 + r)10= US$14b÷ ( 1 + 6.9%)10= US$7.0b
The total value, or equity value, is then the sum of the present value of the future cash flows, which in this case is US$11b. The last step is to then divide the equity value by the number of shares outstanding. Compared to the current share price of US$80.6, the company appears potentially overvalued at the time of writing. Valuations are imprecise instruments though, rather like a telescope - move a few degrees and end up in a different galaxy. Do keep this in mind.
The assumptions
The calculation above is very dependent on two assumptions. The first is the discount rate and the other is the cash flows. If you don't agree with these result, have a go at the calculation yourself and play with the assumptions. The DCF also does not consider the possible cyclicality of an industry, or a company's future capital requirements, so it does not give a full picture of a company's potential performance. Given that we are looking at Cognex as potential shareholders, the cost of equity is used as the discount rate, rather than the cost of capital (or weighted average cost of capital, WACC) which accounts for debt. In this calculation we've used 6.9%, which is based on a levered beta of 1.131. Beta is a measure of a stock's volatility, compared to the market as a whole. We get our beta from the industry average beta of globally comparable companies, with an imposed limit between 0.8 and 2.0, which is a reasonable range for a stable business.
Moving On:
Although the valuation of a company is important, it ideally won't be the sole piece of analysis you scrutinize for a company. It's not possible to obtain a foolproof valuation with a DCF model. Preferably you'd apply different cases and assumptions and see how they would impact the company's valuation. For example, changes in the company's cost of equity or the risk free rate can significantly impact the valuation. What is the reason for the share price exceeding the intrinsic value? For Cognex, we've compiled three pertinent factors you should look at:
- Financial Health: Does CGNX have a healthy balance sheet? Take a look at our free balance sheet analysis with six simple checks on key factors like leverage and risk.
- Future Earnings: How does CGNX's growth rate compare to its peers and the wider market? Dig deeper into the analyst consensus number for the upcoming years by interacting with our free analyst growth expectation chart.
- Other Solid Businesses: Low debt, high returns on equity and good past performance are fundamental to a strong business. Why not explore our interactive list of stocks with solid business fundamentals to see if there are other companies you may not have considered!
PS. The Simply Wall St app conducts a discounted cash flow valuation for every stock on the NASDAQGS every day. If you want to find the calculation for other stocks just search here.
Mobile Infrastructure for Defense and Disaster
The next wave in robotics isn't humanoid. Its fully autonomous towers delivering 5G, ISR, and radar in under 30 minutes, anywhere.
Get the investor briefing before the next round of contracts
Sponsored On Behalf of CiTechNew: AI Stock Screener & Alerts
Our new AI Stock Screener scans the market every day to uncover opportunities.
• Dividend Powerhouses (3%+ Yield)
• Undervalued Small Caps with Insider Buying
• High growth Tech and AI Companies
Or build your own from over 50 metrics.
This article by Simply Wall St is general in nature. We provide commentary based on historical data and analyst forecasts only using an unbiased methodology and our articles are not intended to be financial advice. It does not constitute a recommendation to buy or sell any stock, and does not take account of your objectives, or your financial situation. We aim to bring you long-term focused analysis driven by fundamental data. Note that our analysis may not factor in the latest price-sensitive company announcements or qualitative material. Simply Wall St has no position in any stocks mentioned.
Have feedback on this article? Concerned about the content? Get in touch with us directly. Alternatively, email editorial-team (at) simplywallst.com.
About NasdaqGS:CGNX
Cognex
Provides machine vision products that capture and analyze visual information to automate manufacturing and distribution tasks worldwide.
Flawless balance sheet with proven track record and pays a dividend.
Similar Companies
Market Insights

Weekly Picks

Early mover in a fast growing industry. Likely to experience share price volatility as they scale


A case for CA$31.80 (undiluted), aka 8,616% upside from CA$0.37 (an 86 bagger!).


Moderation and Stabilisation: HOLD: Fair Price based on a 4-year Cycle is $12.08
Recently Updated Narratives


Title: Market Sentiment Is Dead Wrong — Here's Why PSEC Deserves a Second Look


An amazing opportunity to potentially get a 100 bagger

Amazon: Why the World’s Biggest Platform Still Runs on Invisible Economics
Popular Narratives


Crazy Undervalued 42 Baggers Silver Play (Active & Running Mine)


MicroVision will explode future revenue by 380.37% with a vision towards success


NVDA: Expanding AI Demand Will Drive Major Data Center Investments Through 2026
Trending Discussion
