- United States
- /
- Communications
- /
- NasdaqGM:AAOI
After Leaping 26% Applied Optoelectronics, Inc. (NASDAQ:AAOI) Shares Are Not Flying Under The Radar

Applied Optoelectronics, Inc. (NASDAQ:AAOI) shares have continued their recent momentum with a 26% gain in the last month alone. The last month tops off a massive increase of 141% in the last year.
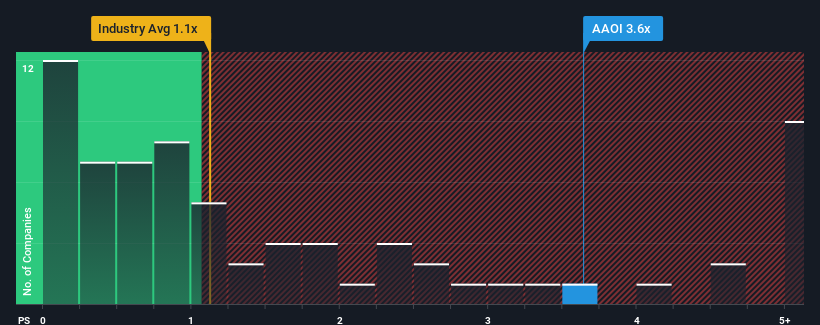
Since its price has surged higher, given around half the companies in the United States' Communications industry have price-to-sales ratios (or "P/S") below 1.1x, you may consider Applied Optoelectronics as a stock to avoid entirely with its 3.6x P/S ratio. Nonetheless, we'd need to dig a little deeper to determine if there is a rational basis for the highly elevated P/S.
View our latest analysis for Applied Optoelectronics
How Applied Optoelectronics Has Been Performing
Applied Optoelectronics could be doing better as its revenue has been going backwards lately while most other companies have been seeing positive revenue growth. It might be that many expect the dour revenue performance to recover substantially, which has kept the P/S from collapsing. However, if this isn't the case, investors might get caught out paying too much for the stock.
Keen to find out how analysts think Applied Optoelectronics' future stacks up against the industry? In that case, our free report is a great place to start.How Is Applied Optoelectronics' Revenue Growth Trending?
The only time you'd be truly comfortable seeing a P/S as steep as Applied Optoelectronics' is when the company's growth is on track to outshine the industry decidedly.
Taking a look back first, the company's revenue growth last year wasn't something to get excited about as it posted a disappointing decline of 2.8%. As a result, revenue from three years ago have also fallen 11% overall. So unfortunately, we have to acknowledge that the company has not done a great job of growing revenue over that time.
Shifting to the future, estimates from the four analysts covering the company suggest revenue should grow by 65% over the next year. That's shaping up to be materially higher than the 8.3% growth forecast for the broader industry.
With this in mind, it's not hard to understand why Applied Optoelectronics' P/S is high relative to its industry peers. Apparently shareholders aren't keen to offload something that is potentially eyeing a more prosperous future.
What Does Applied Optoelectronics' P/S Mean For Investors?
The strong share price surge has lead to Applied Optoelectronics' P/S soaring as well. While the price-to-sales ratio shouldn't be the defining factor in whether you buy a stock or not, it's quite a capable barometer of revenue expectations.
As we suspected, our examination of Applied Optoelectronics' analyst forecasts revealed that its superior revenue outlook is contributing to its high P/S. At this stage investors feel the potential for a deterioration in revenues is quite remote, justifying the elevated P/S ratio. Unless the analysts have really missed the mark, these strong revenue forecasts should keep the share price buoyant.
Before you settle on your opinion, we've discovered 4 warning signs for Applied Optoelectronics (1 can't be ignored!) that you should be aware of.
Of course, profitable companies with a history of great earnings growth are generally safer bets. So you may wish to see this free collection of other companies that have reasonable P/E ratios and have grown earnings strongly.
Mobile Infrastructure for Defense and Disaster
The next wave in robotics isn't humanoid. Its fully autonomous towers delivering 5G, ISR, and radar in under 30 minutes, anywhere.
Get the investor briefing before the next round of contracts
Sponsored On Behalf of CiTechNew: Manage All Your Stock Portfolios in One Place
We've created the ultimate portfolio companion for stock investors, and it's free.
• Connect an unlimited number of Portfolios and see your total in one currency
• Be alerted to new Warning Signs or Risks via email or mobile
• Track the Fair Value of your stocks
Have feedback on this article? Concerned about the content? Get in touch with us directly. Alternatively, email editorial-team (at) simplywallst.com.
This article by Simply Wall St is general in nature. We provide commentary based on historical data and analyst forecasts only using an unbiased methodology and our articles are not intended to be financial advice. It does not constitute a recommendation to buy or sell any stock, and does not take account of your objectives, or your financial situation. We aim to bring you long-term focused analysis driven by fundamental data. Note that our analysis may not factor in the latest price-sensitive company announcements or qualitative material. Simply Wall St has no position in any stocks mentioned.
About NasdaqGM:AAOI
Applied Optoelectronics
Designs, manufactures, and sells fiber-optic networking products in the United States, Taiwan, and China.
Flawless balance sheet with high growth potential.
Similar Companies
Market Insights

Weekly Picks

Early mover in a fast growing industry. Likely to experience share price volatility as they scale


A case for CA$31.80 (undiluted), aka 8,616% upside from CA$0.37 (an 86 bagger!).


Moderation and Stabilisation: HOLD: Fair Price based on a 4-year Cycle is $12.08
Recently Updated Narratives

Airbnb Stock: Platform Growth in a World of Saturation and Scrutiny

Adobe Stock: AI-Fueled ARR Growth Pushes Guidance Higher, But Cost Pressures Loom

Thomson Reuters Stock: When Legal Intelligence Becomes Mission-Critical Infrastructure
Popular Narratives


Crazy Undervalued 42 Baggers Silver Play (Active & Running Mine)


NVDA: Expanding AI Demand Will Drive Major Data Center Investments Through 2026

The AI Infrastructure Giant Grows Into Its Valuation
Trending Discussion

