- United States
- /
- Communications
- /
- NasdaqGM:AAOI
A Look At Applied Optoelectronics' (NASDAQ:AAOI) Share Price Returns


Every investor on earth makes bad calls sometimes. But really big losses can really drag down an overall portfolio. So consider, for a moment, the misfortune of Applied Optoelectronics, Inc. (NASDAQ:AAOI) investors who have held the stock for three years as it declined a whopping 81%. That'd be enough to cause even the strongest minds some disquiet. And over the last year the share price fell 24%, so we doubt many shareholders are delighted. The falls have accelerated recently, with the share price down 30% in the last three months. This could be related to the recent financial results - you can catch up on the most recent data by reading our company report.
We really hope anyone holding through that price crash has a diversified portfolio. Even when you lose money, you don't have to lose the lesson.
See our latest analysis for Applied Optoelectronics
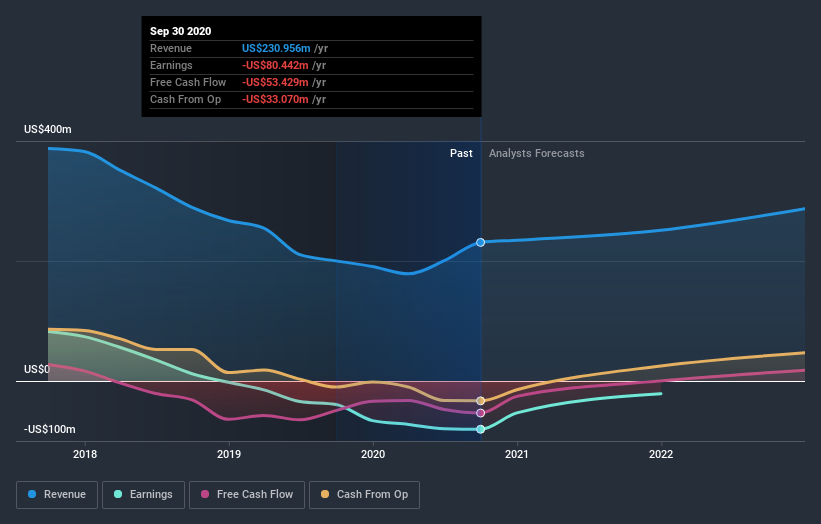
Applied Optoelectronics isn't currently profitable, so most analysts would look to revenue growth to get an idea of how fast the underlying business is growing. Shareholders of unprofitable companies usually expect strong revenue growth. As you can imagine, fast revenue growth, when maintained, often leads to fast profit growth.
In the last three years Applied Optoelectronics saw its revenue shrink by 26% per year. That means its revenue trend is very weak compared to other loss making companies. And as you might expect the share price has been weak too, dropping at a rate of 22% per year. We prefer leave it to clowns to try to catch falling knives, like this stock. It's worth remembering that investors call buying a steeply falling share price 'catching a falling knife' because it is a dangerous pass time.
You can see how earnings and revenue have changed over time in the image below (click on the chart to see the exact values).
If you are thinking of buying or selling Applied Optoelectronics stock, you should check out this FREE detailed report on its balance sheet.
A Different Perspective
While the broader market gained around 23% in the last year, Applied Optoelectronics shareholders lost 24%. However, keep in mind that even the best stocks will sometimes underperform the market over a twelve month period. Regrettably, last year's performance caps off a bad run, with the shareholders facing a total loss of 9% per year over five years. Generally speaking long term share price weakness can be a bad sign, though contrarian investors might want to research the stock in hope of a turnaround. It's always interesting to track share price performance over the longer term. But to understand Applied Optoelectronics better, we need to consider many other factors. Case in point: We've spotted 3 warning signs for Applied Optoelectronics you should be aware of, and 1 of them is concerning.
If you are like me, then you will not want to miss this free list of growing companies that insiders are buying.
Please note, the market returns quoted in this article reflect the market weighted average returns of stocks that currently trade on US exchanges.
If you’re looking to trade Applied Optoelectronics, open an account with the lowest-cost* platform trusted by professionals, Interactive Brokers. Their clients from over 200 countries and territories trade stocks, options, futures, forex, bonds and funds worldwide from a single integrated account. Promoted
If you're looking to trade Applied Optoelectronics, open an account with the lowest-cost platform trusted by professionals, Interactive Brokers.
With clients in over 200 countries and territories, and access to 160 markets, IBKR lets you trade stocks, options, futures, forex, bonds and funds from a single integrated account.
Enjoy no hidden fees, no account minimums, and FX conversion rates as low as 0.03%, far better than what most brokers offer.
Sponsored ContentNew: Manage All Your Stock Portfolios in One Place
We've created the ultimate portfolio companion for stock investors, and it's free.
• Connect an unlimited number of Portfolios and see your total in one currency
• Be alerted to new Warning Signs or Risks via email or mobile
• Track the Fair Value of your stocks
This article by Simply Wall St is general in nature. It does not constitute a recommendation to buy or sell any stock, and does not take account of your objectives, or your financial situation. We aim to bring you long-term focused analysis driven by fundamental data. Note that our analysis may not factor in the latest price-sensitive company announcements or qualitative material. Simply Wall St has no position in any stocks mentioned.
*Interactive Brokers Rated Lowest Cost Broker by StockBrokers.com Annual Online Review 2020
Have feedback on this article? Concerned about the content? Get in touch with us directly. Alternatively, email editorial-team@simplywallst.com.
About NasdaqGM:AAOI
Applied Optoelectronics
Designs, manufactures, and sells fiber-optic networking products in the United States, Taiwan, and China.
Exceptional growth potential with adequate balance sheet.
Similar Companies
Market Insights

Community Narratives

