Advertisement
- United States
- /
- IT
- /
- NYSE:GLOB
What the Recent Globant Rebound Means for Investors in 2025

Simply Wall St
Reviewed by Bailey Pemberton
If you’ve been staring at Globant’s stock chart lately, you’re not alone. It is completely normal to wonder whether now is the right moment to buy, hold, or simply watch from the sidelines. After all, seeing a price that closed at $59.45 and year-to-date returns that are down 72.1% would make anyone look twice. Yet, in the past week, Globant’s share price actually bounced back by 6.2%, showing just how quickly momentum can shift in a market like this.
It’s not just whiplash from recent volatility, either. Over the last five years, shareholders have endured a decline of nearly 69%. This kind of long-term drop often signals a major reassessment of a company by the market, sometimes because of changing risk perceptions or evolving industry expectations. In Globant’s case, broader shifts in technology stock sentiment and market uncertainty seem to have driven much of the turbulence, with growth stocks seeing both periods of heavy selling and brief rebounds as investors’ outlooks evolve.
But does the price action mean Globant is now undervalued? Based on our valuation screen, the company scores a 4 out of 6 on underpriced metrics, suggesting real pockets of value for patient investors. Of course, stock charts only tell part of the story. The real question is whether these numbers reflect an opportunity or a warning sign.
Let’s break down the main valuation approaches for Globant next, and just as importantly, hint at a better way for investors to make sense of the numbers before deciding what comes next.
Why Globant is lagging behind its peers
Approach 1: Globant Discounted Cash Flow (DCF) Analysis
The Discounted Cash Flow (DCF) model works by projecting a company’s future cash flows and then discounting those estimates back to today’s dollars. This approach aims to find the true intrinsic value of the stock based on the money the business is expected to generate in the years ahead.
For Globant, this DCF analysis uses cash flow projections derived from a 2 Stage Free Cash Flow to Equity model. The company’s last twelve months (LTM) Free Cash Flow stands at $130.8 million. According to analyst estimates, annual free cash flows are expected to grow steadily, with projections reaching $275.4 million by 2026 and $323.6 million by 2029. After 2029, Simply Wall St extrapolates further free cash flow growth, factoring in more conservative annual increases.
Using these projections, the DCF model indicates a fair value for Globant shares of $117.86. This suggests the stock currently trades at a 49.6% discount compared to its intrinsic value, with shares priced at just $59.45.
In summary, the DCF model identifies Globant as potentially deeply undervalued, highlighting a significant margin of safety for investors willing to look past short-term volatility.
Result: UNDERVALUED
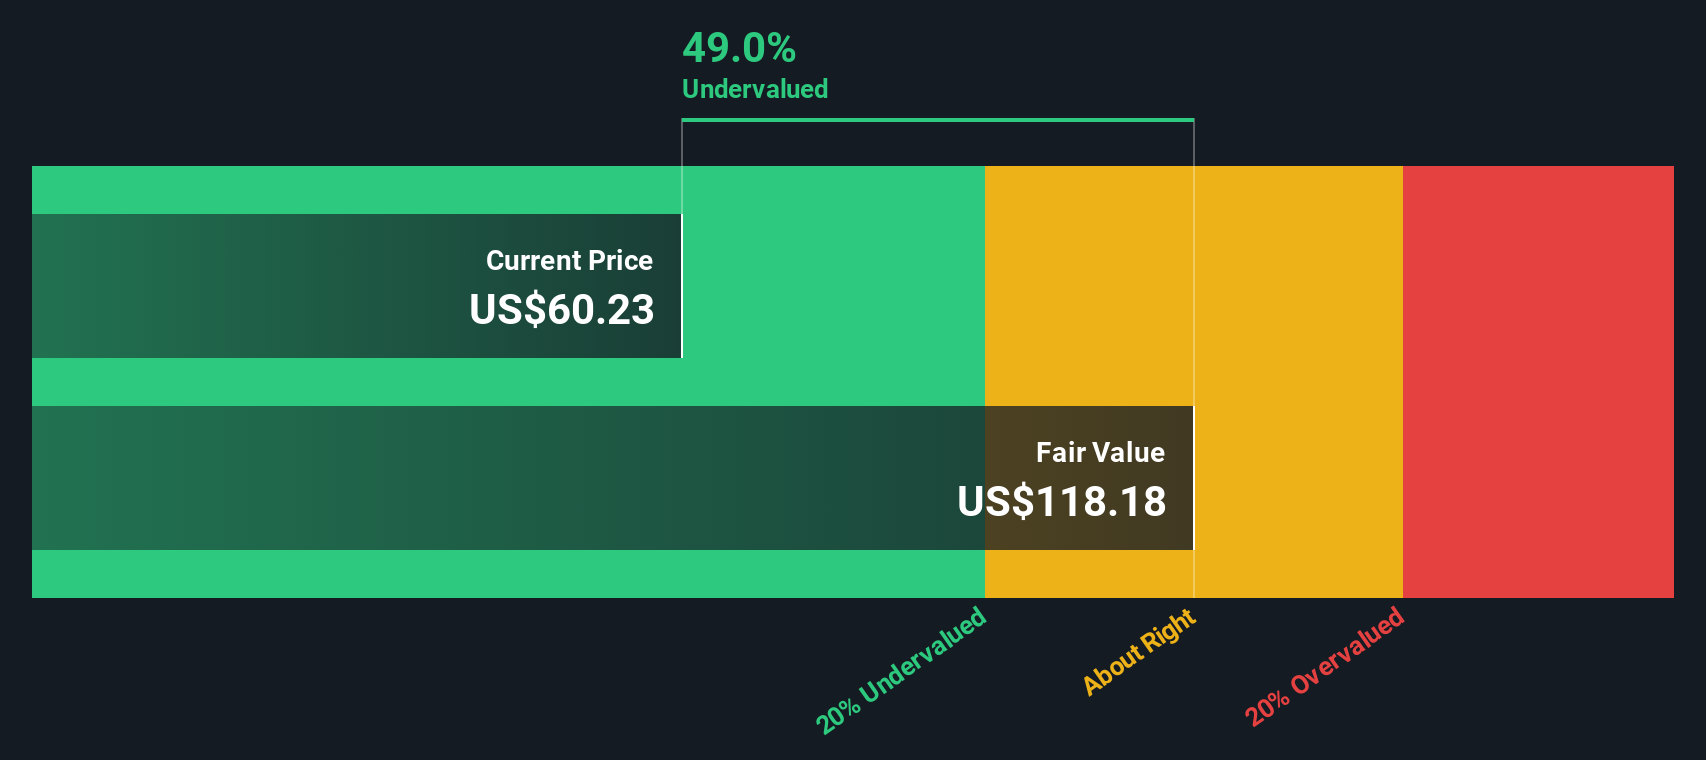
Our Discounted Cash Flow (DCF) analysis suggests Globant is undervalued by 49.6%. Track this in your watchlist or portfolio, or discover more undervalued stocks.
Approach 2: Globant Price vs Earnings
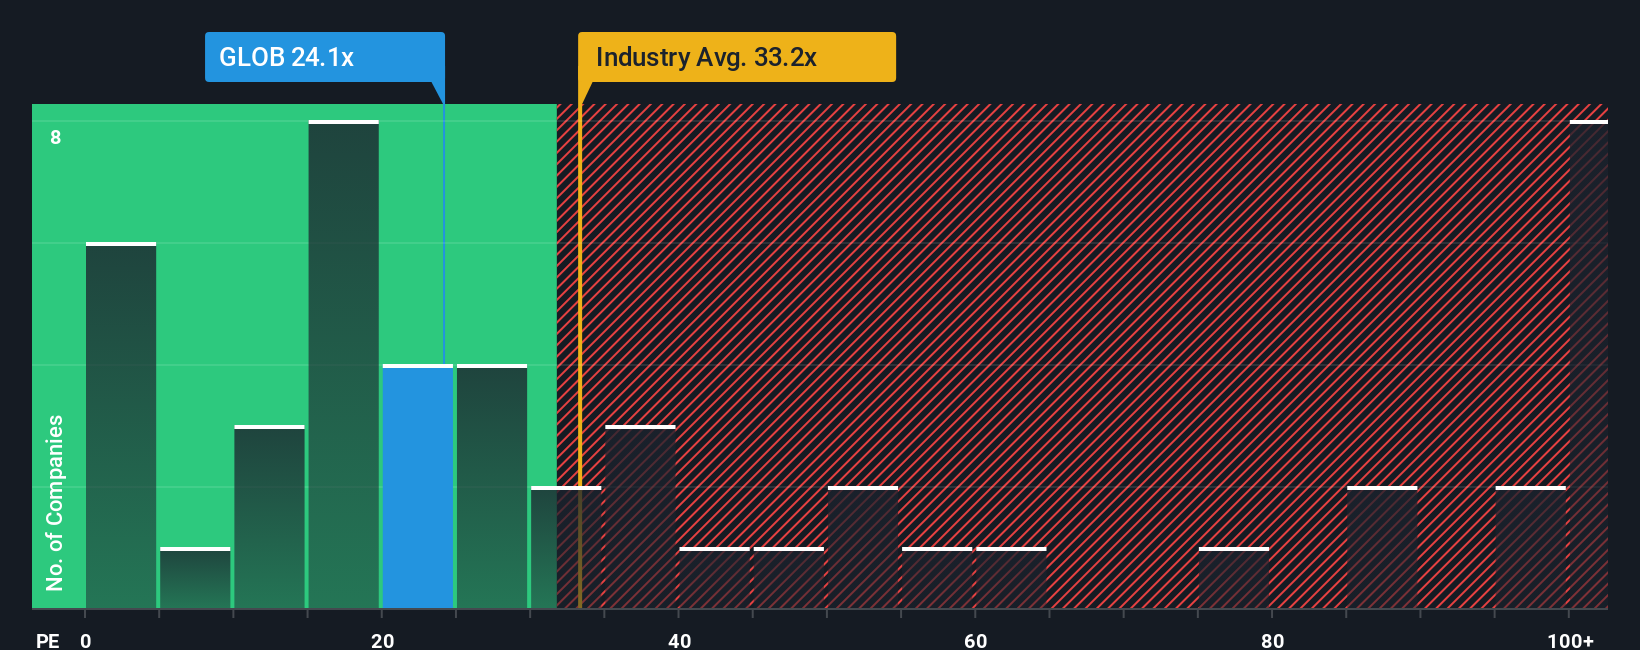
The Price-to-Earnings (PE) ratio is one of the most widely used ways to value profitable companies like Globant. It helps investors see how much they are paying for each dollar of the company’s earnings, making it useful for comparing companies regardless of their absolute share price.
What counts as a “normal” or “fair” PE ratio depends on a mix of growth expectations and risk. Faster-growing, more profitable companies usually command higher PE ratios. In contrast, companies facing more uncertainty or slower growth tend to trade at lower multiples.
As it stands, Globant shares currently trade on a PE ratio of 23.8x. By comparison, the average PE across similar IT industry peers is 20.6x, and the broader industry average sits at 32.7x. This suggests Globant is valued slightly higher than the typical peer but still below the overall industry mean.
To provide a more tailored benchmark, Simply Wall St calculates a Fair Ratio for Globant of 38.2x. This proprietary metric considers a range of company-specific factors such as earnings growth, profit margins, risk profile, industry trends, and market cap. Unlike standard peer or industry comparisons, the Fair Ratio is designed to better reflect Globant’s unique strengths and challenges.
Comparing Globant’s actual PE of 23.8x with its Fair Ratio of 38.2x, the stock appears undervalued based on where it should trade given its fundamentals and industry context.
Result: UNDERVALUED
PE ratios tell one story, but what if the real opportunity lies elsewhere? Discover companies where insiders are betting big on explosive growth.
Upgrade Your Decision Making: Choose your Globant Narrative
Earlier we mentioned that there's an even better way to understand valuation, so let's introduce you to Narratives. A Narrative is your way of connecting the story you believe about a company with a concrete financial forecast. In other words, you link your view of Globant’s strategy and future prospects to estimates for its revenue, earnings, and profit margins, and then derive your own fair value for the shares.
With Narratives, you move beyond just the numbers and tie in your reasoning, so every Fair Value has a clear story behind it. These are accessible for everyone on Simply Wall St's Community page, where millions of investors share, adjust, and update their perspectives as new news or earnings come out.
Narratives make deciding when to buy or sell simpler: you compare the Fair Value implied by a Narrative with the current share price to see if a gap exists, and how your outlook stacks up against others. Each Narrative updates dynamically as fresh information arrives, keeping your decisions relevant and timely.
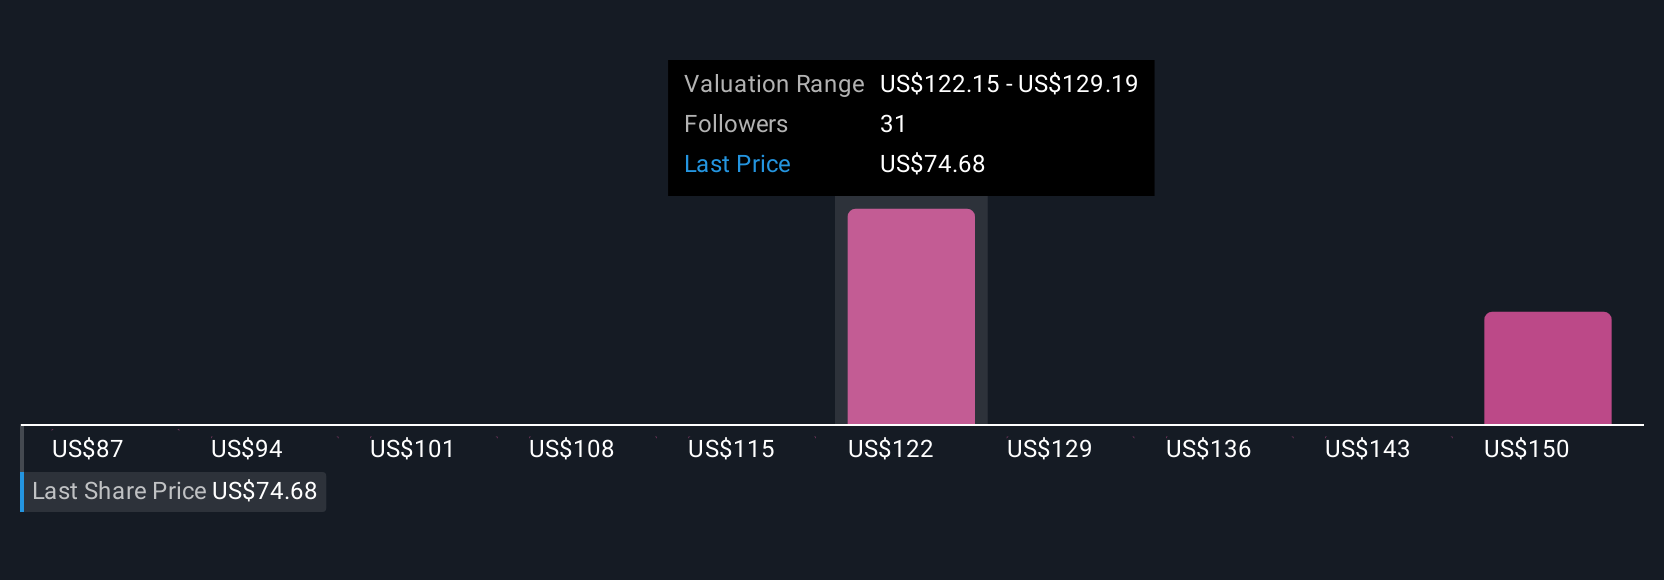
For example, on Globant, the most optimistic Narrative sees significant rewards from expanding AI platforms and robust recurring revenues, with a fair value as high as $240, while the most cautious Narrative highlights persistent growth uncertainty and intense competition, setting fair value at just $74.
Do you think there's more to the story for Globant? Create your own Narrative to let the Community know!
This article by Simply Wall St is general in nature. We provide commentary based on historical data and analyst forecasts only using an unbiased methodology and our articles are not intended to be financial advice. It does not constitute a recommendation to buy or sell any stock, and does not take account of your objectives, or your financial situation. We aim to bring you long-term focused analysis driven by fundamental data. Note that our analysis may not factor in the latest price-sensitive company announcements or qualitative material. Simply Wall St has no position in any stocks mentioned.
New: Manage All Your Stock Portfolios in One Place
We've created the ultimate portfolio companion for stock investors, and it's free.
• Connect an unlimited number of Portfolios and see your total in one currency
• Be alerted to new Warning Signs or Risks via email or mobile
• Track the Fair Value of your stocks
Have feedback on this article? Concerned about the content? Get in touch with us directly. Alternatively, email editorial-team@simplywallst.com
About NYSE:GLOB
Excellent balance sheet and good value.
Similar Companies
Market Insights

Advertisement
Community Narratives
The Next Phase of Energy Storage: How NeoVolta Is Tackling America’s Power Crunch
Fair Value US$7.50|35.2% undervalued
MA
Community Contributor
Why EnSilica is Worth Possibly 13x its Current Price
Fair Value UK£5.00|89.8% undervalued
DO
Community Contributor
M&A Activity, Industry Diversification & A Defense Contract Monopoly Will Push BWXT For Healthy Long-Term Growth
Fair Value US$220.00|15.6% undervalued
CL
Community Contributor
A case for Cassiar Gold Corp (TSXV: GLDC) to reach CAD$8-10 before 2030 (X30-37)
Fair Value CA$10.00|97.1% undervalued
AG
Community Contributor