Advertisement
- United States
- /
- IT
- /
- NYSE:DAVA
Is Endava (NYSE:DAVA) Using Too Much Debt?
The external fund manager backed by Berkshire Hathaway's Charlie Munger, Li Lu, makes no bones about it when he says 'The biggest investment risk is not the volatility of prices, but whether you will suffer a permanent loss of capital.' It's only natural to consider a company's balance sheet when you examine how risky it is, since debt is often involved when a business collapses. We note that Endava plc (NYSE:DAVA) does have debt on its balance sheet. But is this debt a concern to shareholders?
Why Does Debt Bring Risk?
Debt assists a business until the business has trouble paying it off, either with new capital or with free cash flow. Ultimately, if the company can't fulfill its legal obligations to repay debt, shareholders could walk away with nothing. However, a more common (but still painful) scenario is that it has to raise new equity capital at a low price, thus permanently diluting shareholders. Of course, plenty of companies use debt to fund growth, without any negative consequences. The first step when considering a company's debt levels is to consider its cash and debt together.
View our latest analysis for Endava
What Is Endava's Debt?
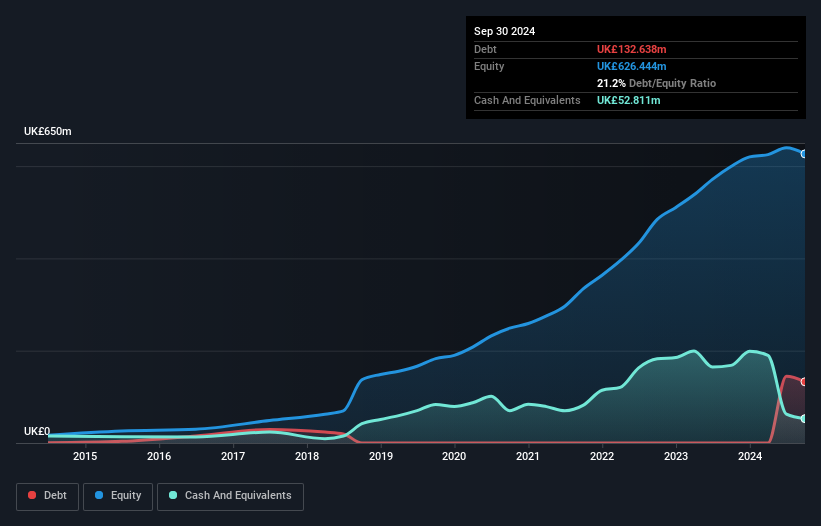
You can click the graphic below for the historical numbers, but it shows that as of September 2024 Endava had UK£132.6m of debt, an increase on none, over one year. On the flip side, it has UK£52.8m in cash leading to net debt of about UK£79.8m.
How Healthy Is Endava's Balance Sheet?
We can see from the most recent balance sheet that Endava had liabilities of UK£137.4m falling due within a year, and liabilities of UK£203.9m due beyond that. Offsetting these obligations, it had cash of UK£52.8m as well as receivables valued at UK£208.2m due within 12 months. So its liabilities total UK£80.3m more than the combination of its cash and short-term receivables.
Given Endava has a market capitalization of UK£1.48b, it's hard to believe these liabilities pose much threat. Having said that, it's clear that we should continue to monitor its balance sheet, lest it change for the worse.
We use two main ratios to inform us about debt levels relative to earnings. The first is net debt divided by earnings before interest, tax, depreciation, and amortization (EBITDA), while the second is how many times its earnings before interest and tax (EBIT) covers its interest expense (or its interest cover, for short). The advantage of this approach is that we take into account both the absolute quantum of debt (with net debt to EBITDA) and the actual interest expenses associated with that debt (with its interest cover ratio).
Endava's net debt to EBITDA ratio of about 1.6 suggests only moderate use of debt. And its strong interest cover of 13.0 times, makes us even more comfortable. In fact Endava's saving grace is its low debt levels, because its EBIT has tanked 79% in the last twelve months. When a company sees its earnings tank, it can sometimes find its relationships with its lenders turn sour. When analysing debt levels, the balance sheet is the obvious place to start. But it is future earnings, more than anything, that will determine Endava's ability to maintain a healthy balance sheet going forward. So if you're focused on the future you can check out this free report showing analyst profit forecasts.
Finally, a business needs free cash flow to pay off debt; accounting profits just don't cut it. So the logical step is to look at the proportion of that EBIT that is matched by actual free cash flow. Over the last three years, Endava actually produced more free cash flow than EBIT. That sort of strong cash generation warms our hearts like a puppy in a bumblebee suit.
Our View
The good news is that Endava's demonstrated ability to cover its interest expense with its EBIT delights us like a fluffy puppy does a toddler. But the stark truth is that we are concerned by its EBIT growth rate. Looking at all the aforementioned factors together, it strikes us that Endava can handle its debt fairly comfortably. Of course, while this leverage can enhance returns on equity, it does bring more risk, so it's worth keeping an eye on this one. The balance sheet is clearly the area to focus on when you are analysing debt. However, not all investment risk resides within the balance sheet - far from it. For example, we've discovered 3 warning signs for Endava that you should be aware of before investing here.
Of course, if you're the type of investor who prefers buying stocks without the burden of debt, then don't hesitate to discover our exclusive list of net cash growth stocks, today.
Valuation is complex, but we're here to simplify it.
Discover if Endava might be undervalued or overvalued with our detailed analysis, featuring fair value estimates, potential risks, dividends, insider trades, and its financial condition.
Access Free AnalysisHave feedback on this article? Concerned about the content? Get in touch with us directly. Alternatively, email editorial-team (at) simplywallst.com.
This article by Simply Wall St is general in nature. We provide commentary based on historical data and analyst forecasts only using an unbiased methodology and our articles are not intended to be financial advice. It does not constitute a recommendation to buy or sell any stock, and does not take account of your objectives, or your financial situation. We aim to bring you long-term focused analysis driven by fundamental data. Note that our analysis may not factor in the latest price-sensitive company announcements or qualitative material. Simply Wall St has no position in any stocks mentioned.
About NYSE:DAVA
Endava
Provides technology services in North America, Europe, the United Kingdom, and internationally.
Undervalued with moderate growth potential.
Similar Companies
Market Insights


Advertisement
Weekly Picks
LO


Lou_Basenese on Virtuix Holdings ·
From a “Shark Tank” Snub to an Air Force “Yes”: Why Virtuix at $3.50 May Be the Market’s Most Mispriced AI Story
Fair Value:US$7.562.8% undervalued
22 followersusers have followed this narrative
0 commentsusers have commented on this narrative
3 likesusers have liked this narrative
IN


Investingwilly on Mastercard ·
Mastercard: The Best Dividend Stock You're Ignoring
Fair Value:US$75033.5% undervalued
71 followersusers have followed this narrative
1 commentusers have commented on this narrative
9 likesusers have liked this narrative
TR


tripledub on Intuit ·
A Wonderful Business at a Not-So-Wonderful Price
Fair Value:US$56052.2% undervalued
64 followersusers have followed this narrative
4 commentsusers have commented on this narrative
30 likesusers have liked this narrative
TA


Talos on MindWalk Holdings ·
The Asymmetric TechBio Play: MindWalk Holdings and the Valuation Disconnect
Fair Value:US$8.2780.9% undervalued
35 followersusers have followed this narrative
0 commentsusers have commented on this narrative
9 likesusers have liked this narrative
Recently Updated Narratives
RO


RockeTeller on Orezone Gold ·
Orezone Gold Could 3X–5X, Bomboré Ramp + Casa Berardi Quebec Asset Delivers 160-180Koz in 2026
Fair Value:CA$10.6878.4% undervalued
11 followersusers have followed this narrative
4 commentsusers have commented on this narrative
1 likeusers have liked this narrative
IV

Ivoed on Netflix ·
Netflix’s Business Quality Is Clear. The Harder Question Is Whether The Stock Is Still Cheap
Fair Value:US$8210.0% undervalued
4 followersusers have followed this narrative
0 commentsusers have commented on this narrative
0 likesusers have liked this narrative
RO

RockeTeller on NeXGold Mining ·
NexGold Mining: 4.7Moz M&I Resources, $100M Cash + Debt-Free, Construction Decision 2026 Undervalued Canadian Gold Developer
Fair Value:CA$39.5296.9% undervalued
5 followersusers have followed this narrative
3 commentsusers have commented on this narrative
1 likeusers have liked this narrative
Popular Narratives
IN
Investingwilly on Mastercard ·
Mastercard: The Best Dividend Stock You're Ignoring
Fair Value:US$75033.5% undervalued
71 followersusers have followed this narrative
1 commentusers have commented on this narrative
9 likesusers have liked this narrative
HA


HarishPK on Adobe ·
Adobe: A Probabilistic Case for Undervaluation
Fair Value:US$319.9636.6% undervalued
62 followersusers have followed this narrative
9 commentsusers have commented on this narrative
19 likesusers have liked this narrative
MA


martinarauz on Nu Holdings ·
Investment Analysis (May 2026)
Fair Value:US$22.7442.1% undervalued
68 followersusers have followed this narrative
0 commentsusers have commented on this narrative
17 likesusers have liked this narrative
