Advertisement
- United States
- /
- Software
- /
- NYSE:CRCL
Is Circle Internet Group a Hidden Gem After the Recent 50% Price Drop?

Simply Wall St
Reviewed by Bailey Pemberton
- Wondering if Circle Internet Group could be a hidden gem or a value trap? You are not alone, and we are about to dig into the numbers together.
- The stock has had a wild ride lately, dropping 12.9% over the past week and sinking nearly 50% in the last month. This has fueled speculation about its growth prospects and shifting risk profile.
- Recent headlines have spotlighted Circle Internet Group's sudden price swings as investors react to changes in the tech sector and broader market sentiment. Notable news stories have highlighted regulatory discussions around stablecoins and strategic partnerships that have put the company back in the public eye.
- On paper, Circle scores a 3 out of 6 on our valuation checks, suggesting some areas of undervaluation but also potential red flags. Next, we will break down the usual ways investors figure out what a company is really worth, but stick around to see why there might be a smarter way to look at value by the end of the article.
Approach 1: Circle Internet Group Discounted Cash Flow (DCF) Analysis
A Discounted Cash Flow (DCF) model estimates what a company is worth today by projecting its future cash flows and discounting them back to the present. For Circle Internet Group, this approach uses the 2 Stage Free Cash Flow to Equity method with cash flow projections in United States dollars.
The company's latest twelve-month Free Cash Flow is $329.2 Million. Analyst forecasts suggest robust growth over the next few years, with projected Free Cash Flows rising to $1.4 Billion by 2029. While analysts provide detailed estimates through 2029, further projections are extrapolated to provide a full ten-year outlook by modeling experts.
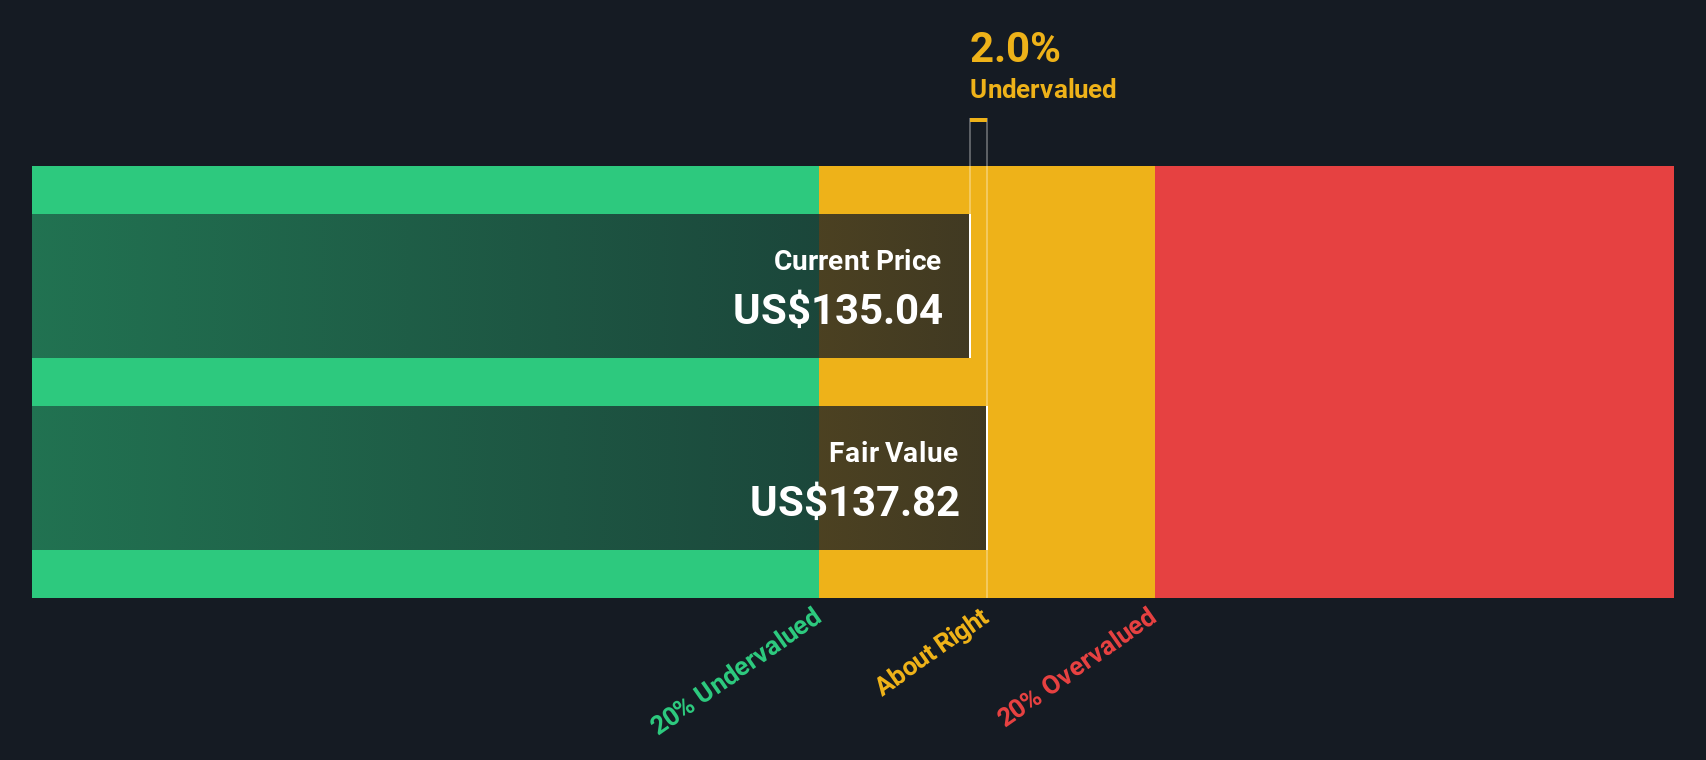
Using these projections, the model calculates an intrinsic value of $140.47 per share for Circle Internet Group. This figure implies the stock is trading at a 49.2% discount to its calculated fair value based on anticipated cash flows.
In simpler terms, the DCF model suggests Circle Internet Group is significantly undervalued relative to the cash it is forecast to generate in the coming decade.
Result: UNDERVALUED
Our Discounted Cash Flow (DCF) analysis suggests Circle Internet Group is undervalued by 49.2%. Track this in your watchlist or portfolio, or discover 926 more undervalued stocks based on cash flows.
Approach 2: Circle Internet Group Price vs Sales
The Price-to-Sales (P/S) ratio is a widely used valuation metric for companies like Circle Internet Group, especially when profits are volatile or earnings are negative. This ratio allows investors to benchmark a company's value relative to the revenues it generates, making it a useful tool for high-growth tech firms where traditional measures like earnings might not fully reflect potential.
A “normal” or “fair” P/S ratio depends on how quickly a company is growing and the risks it faces. Higher growth rates and strong market positions generally warrant a higher multiple, while greater uncertainty can have the opposite effect. This is why comparing P/S ratios only to peers or industry averages can be helpful, but it does not always give the full picture.
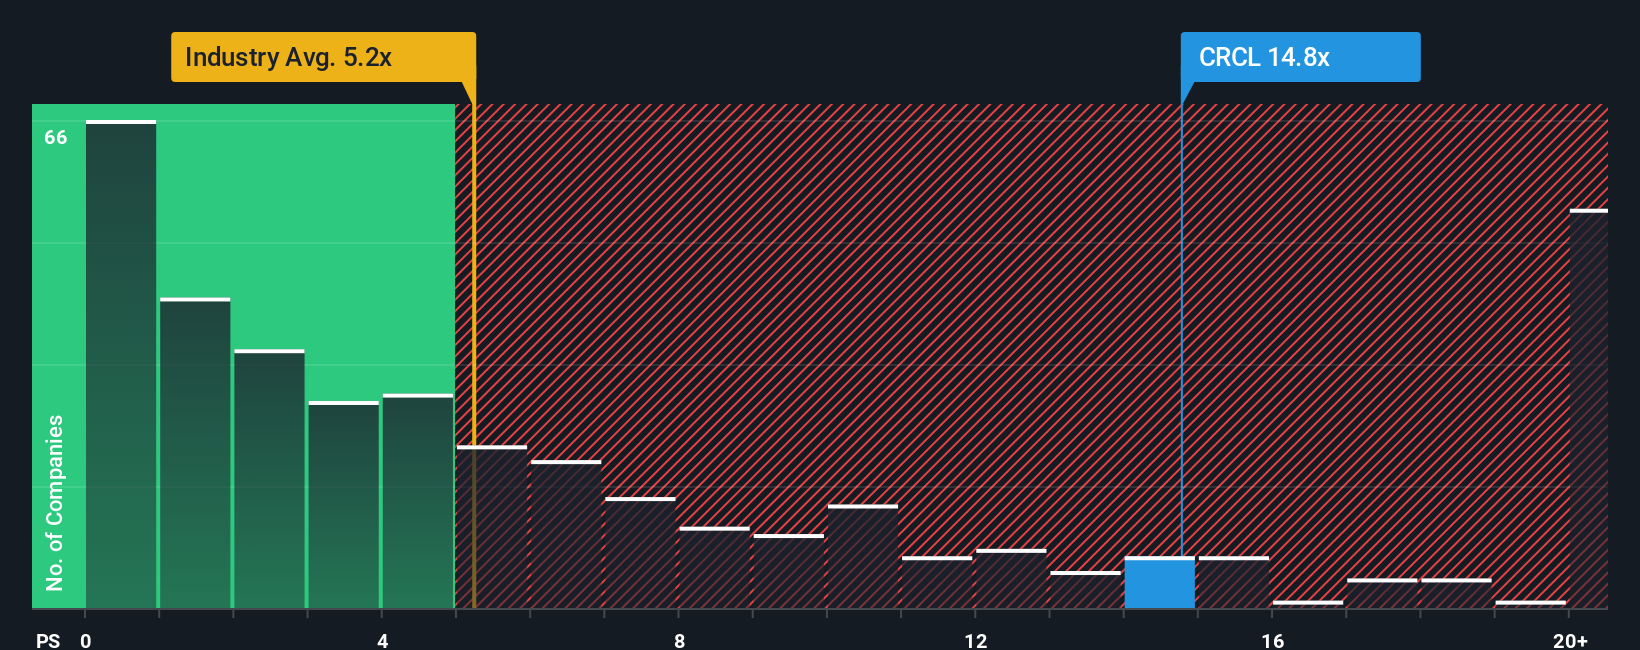
Circle Internet Group is currently trading at a P/S ratio of 7x. When stacked up against the Software industry average of 4.6x and a peer average of 8.6x, Circle sits above the industry’s typical range but slightly below its immediate peers. However, not all software companies are created equal. This is where Simply Wall St’s “Fair Ratio” comes in. This proprietary benchmark factors in key elements like the company’s growth prospects, profit margins, risk profile, industry dynamics, and market cap to suggest what a sustainable P/S multiple should look like.
Comparing the Fair Ratio to the actual P/S, Circle Internet Group appears fairly valued according to these broader criteria. This approach adds more clarity than a simple peer or sector comparison because it is tailored to the company's own strengths and challenges.
Result: ABOUT RIGHT
PS ratios tell one story, but what if the real opportunity lies elsewhere? Discover 1430 companies where insiders are betting big on explosive growth.
Upgrade Your Decision Making: Choose your Circle Internet Group Narrative
Earlier we mentioned that there is an even better way to understand valuation, so let's introduce you to Narratives. Think of a Narrative as your personal investment story—a simple, shareable description of what you believe Circle Internet Group’s future looks like, supported by your own estimates for growth, profitability, and fair value. Narratives help you go beyond the numbers by connecting your unique perspective on the company to a forecast, then instantly showing whether its current price looks attractive or not.
On Simply Wall St’s Community page, Narratives are an easy and accessible tool used by millions of investors that guide decision making. Whenever market news or earnings are released, Narratives update dynamically so your fair value check is always current. This means you can compare your Narrative’s fair value for Circle with the actual share price to decide if it is time to buy or sell, or if it is worth waiting for a better entry point.
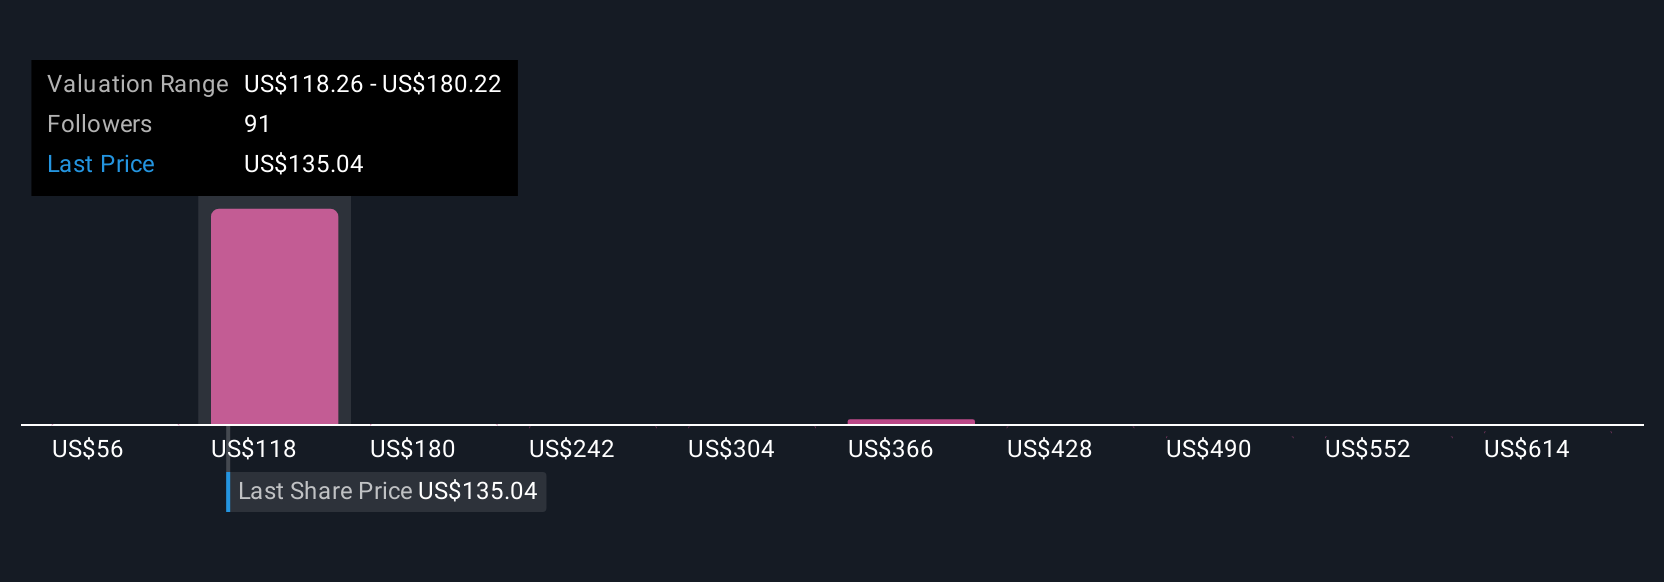
For example, some investors currently project Circle’s fair value as high as $326 per share, seeing huge long-term growth, while others are much more conservative, valuing it closer to $122 based on risks and industry pressures.
Do you think there's more to the story for Circle Internet Group? Head over to our Community to see what others are saying!
This article by Simply Wall St is general in nature. We provide commentary based on historical data and analyst forecasts only using an unbiased methodology and our articles are not intended to be financial advice. It does not constitute a recommendation to buy or sell any stock, and does not take account of your objectives, or your financial situation. We aim to bring you long-term focused analysis driven by fundamental data. Note that our analysis may not factor in the latest price-sensitive company announcements or qualitative material. Simply Wall St has no position in any stocks mentioned.
New: AI Stock Screener & Alerts
Our new AI Stock Screener scans the market every day to uncover opportunities.
• Dividend Powerhouses (3%+ Yield)
• Undervalued Small Caps with Insider Buying
• High growth Tech and AI Companies
Or build your own from over 50 metrics.
Have feedback on this article? Concerned about the content? Get in touch with us directly. Alternatively, email editorial-team@simplywallst.com
About NYSE:CRCL
Circle Internet Group
Operates as a platform, network, and market infrastructure for stablecoin and blockchain applications.
Flawless balance sheet with high growth potential.
Similar Companies
Market Insights

Advertisement
Community Narratives
MicroVision will explode future revenue by 380.37% with a vision towards success
Fair Value US$60.00|98.4% undervalued
TH
Community Contributor
The Indispensable Artery for a New North American Economy
Fair Value CA$132.87|1.3% undervalued
TI
Community Contributor