Advertisement
- United States
- /
- IT
- /
- NasdaqGS:WIX
Is Wixcom (WIX) Offering Opportunity After Sharp Multi Year Share Price Slide

Reviewed by Bailey Pemberton
- If you are wondering whether Wix.com shares are now offering value or just a value trap, this article will walk through what the numbers are actually saying about the stock.
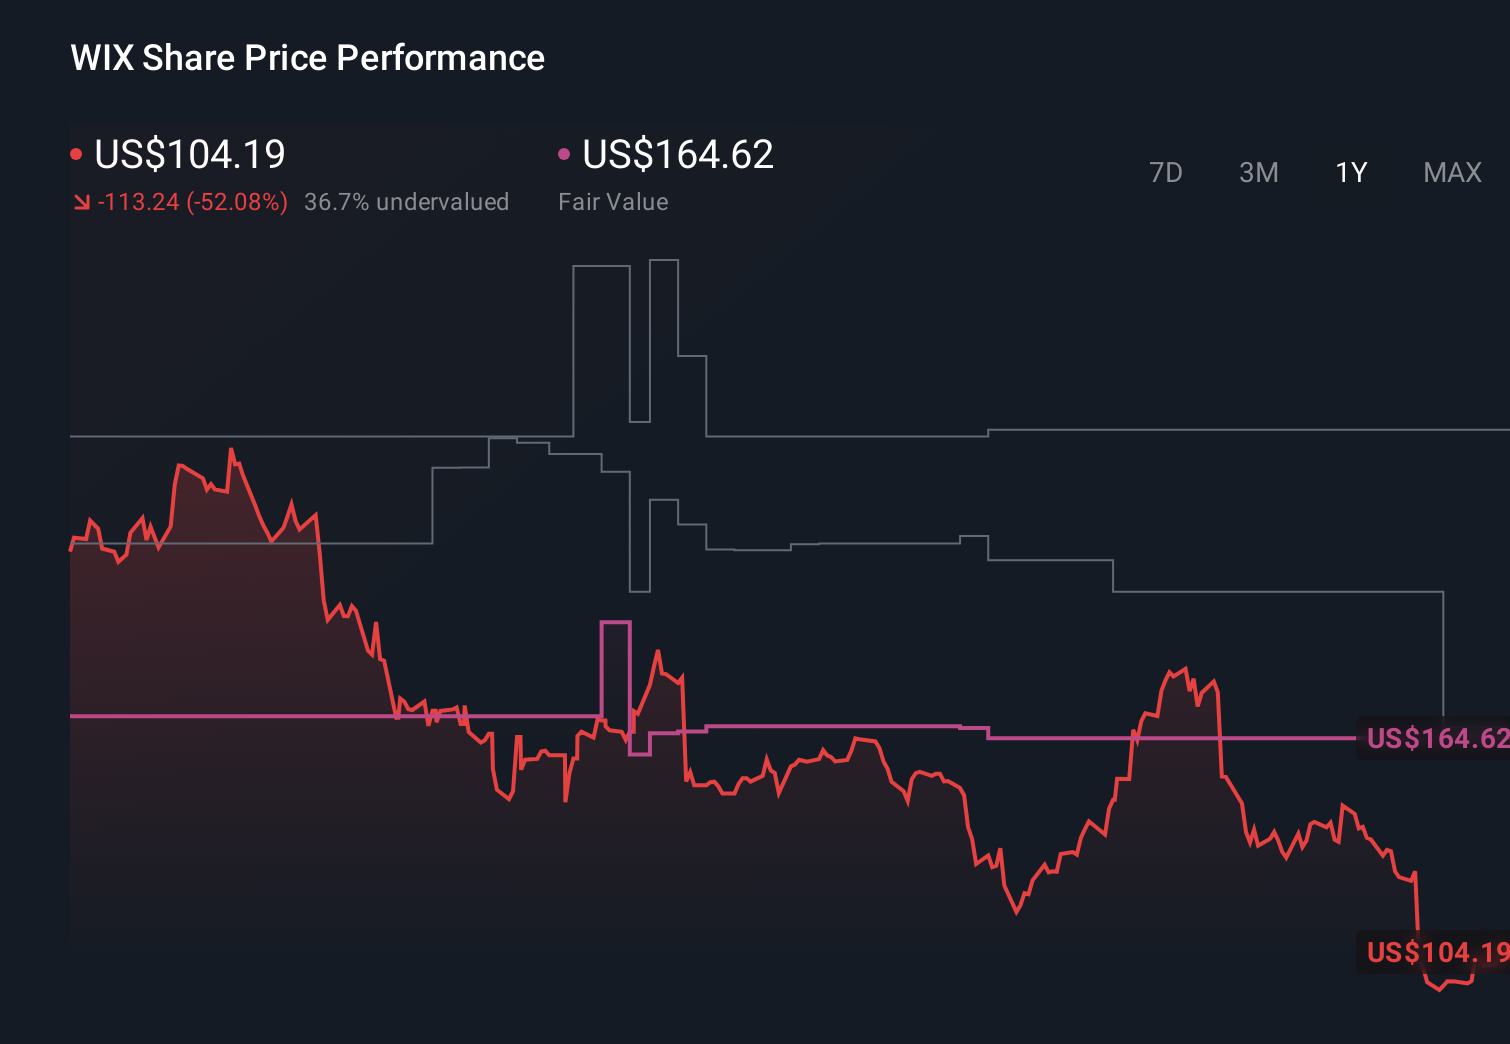
- Wix.com recently closed at US$70.95, with returns of a 6.0% decline over 7 days, a 21.5% decline over 30 days, a 29.7% decline year to date, a 68.6% decline over 1 year and a 79.4% decline over 5 years. This naturally raises questions about both risk and potential opportunity.
- Recent coverage has focused on Wix.com as a key player in website creation and online presence tools, with attention on how its business model fits into broader trends in digital commerce and small business activity. This context helps frame the recent share price performance as investors reassess what they are willing to pay for this kind of software exposure.
- On Simply Wall St's valuation checks, Wix.com scores a 4 out of 6. Next we will break down what that means across different valuation methods, before finishing with a more complete way to think about the stock's value that goes beyond the headline metrics.
Find out why Wix.com's -68.6% return over the last year is lagging behind its peers.
Approach 1: Wix.com Discounted Cash Flow (DCF) Analysis
A Discounted Cash Flow, or DCF, model estimates what a company might be worth by projecting the cash it could generate in the future and then discounting those cash flows back into today’s dollars.
For Wix.com, the latest twelve month Free Cash Flow (FCF) is reported at about $518.1 million. Analysts and model assumptions are used to project this figure forward, with Simply Wall St carrying forecasts out to 2035. For example, projected FCF for 2030 is $890.9 million, with intermediate years such as 2026 and 2027 sitting at $576.4 million and $649.9 million respectively. Amounts beyond the analyst window are extrapolated by Simply Wall St rather than coming from direct analyst estimates.
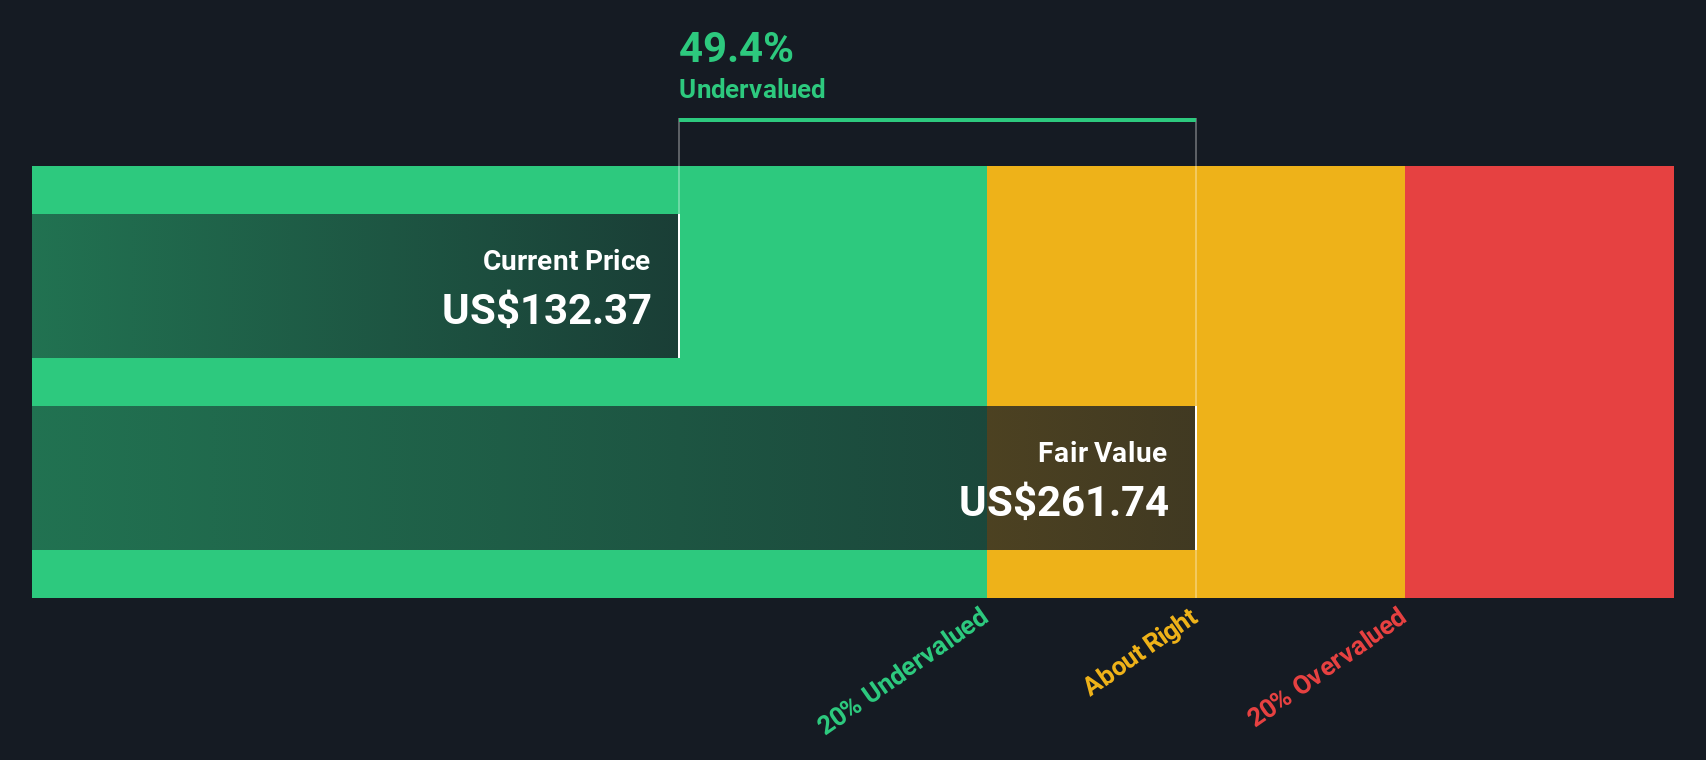
Using a 2 Stage Free Cash Flow to Equity model based on these projections, the estimated intrinsic value for Wix.com is $159.56 per share. Compared with the recent share price of $70.95, this implies the stock is about 55.5% below that modelled value, which indicates Wix.com may be trading at a substantial discount on this measure.
Result: UNDERVALUED
Our Discounted Cash Flow (DCF) analysis suggests Wix.com is undervalued by 55.5%. Track this in your watchlist or portfolio, or discover 55 more high quality undervalued stocks.
Approach 2: Wix.com Price vs Earnings
For a company that is generating earnings, the P/E ratio is often a useful shorthand for how much investors are paying for each dollar of profit. Higher growth expectations and lower perceived risk are usually associated with a higher “normal” P/E, while slower growth or higher risk tends to pull that fair range down.
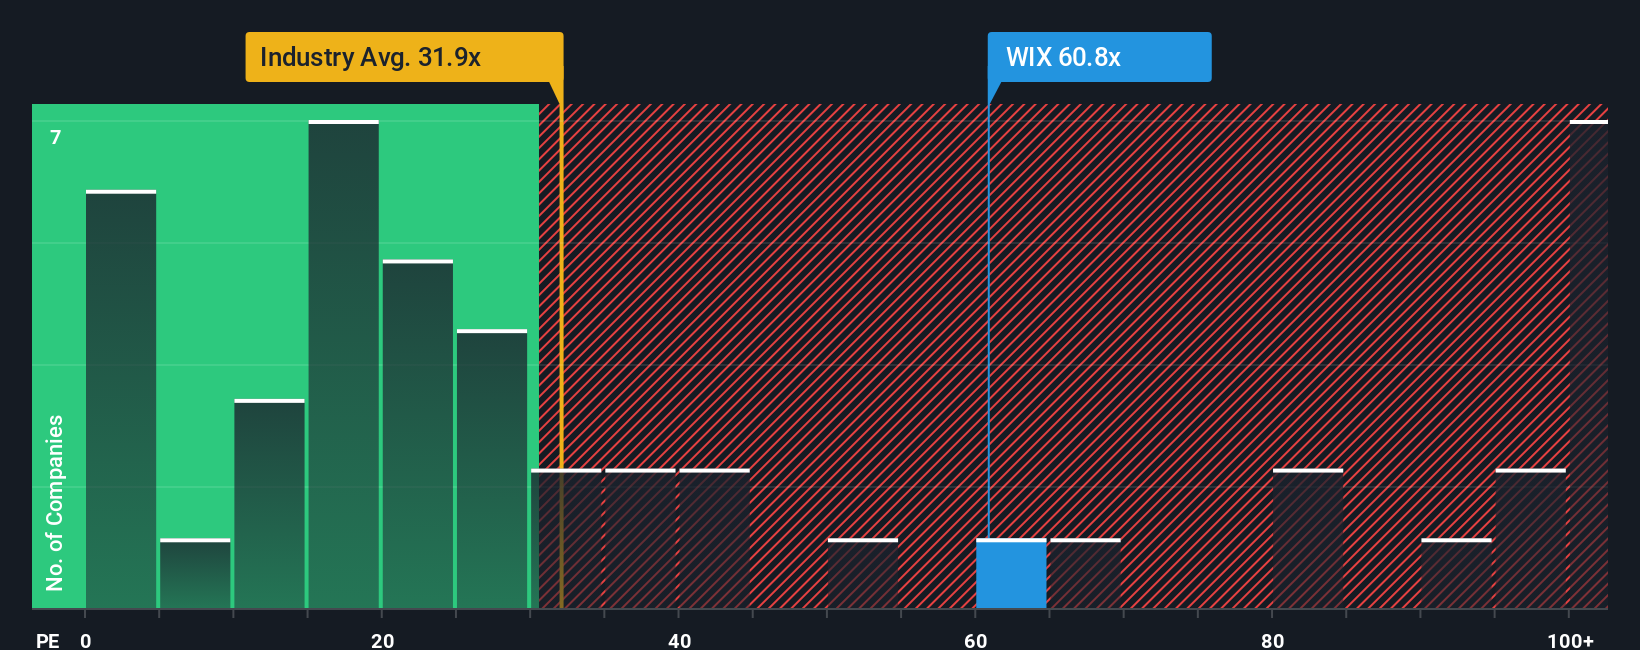
Wix.com is currently trading on a P/E of 27.9x. That is above the broader IT industry average of about 22.9x, but below the peer group average of 30.7x. On its own, that mix of numbers can be hard to interpret, because it does not fully account for Wix.com’s specific growth profile, margins, size and risk.
Simply Wall St’s Fair Ratio aims to address this by estimating what P/E might be expected for Wix.com based on factors such as its earnings growth, industry, profit margin, market cap and risk indicators. For Wix.com, this Fair Ratio is 34.5x, which is higher than the current 27.9x P/E. On this metric, the stock appears to be trading below the level suggested by those fundamentals.
Result: UNDERVALUED
P/E ratios tell one story, but what if the real opportunity lies elsewhere? Start investing in legacies, not executives. Discover our 23 top founder-led companies.
Upgrade Your Decision Making: Choose your Wix.com Narrative
Earlier we mentioned that there is an even better way to understand valuation, so let us introduce you to Narratives, a simple tool on Simply Wall St’s Community page that lets you link your view of Wix.com’s story to your own forecast and fair value. You can then compare that fair value to today’s price, with the Narrative updating automatically when new news or earnings arrive.
In practice, one Wix.com Narrative might lean closer to the higher fair value assumptions, where AI features, Base44 and user growth are seen as strong long term drivers. Another aligns with the lower fair value case, where higher AI and Base44 costs, competition and margin pressure are the focus. By seeing both side by side you can decide which story feels more realistic to you and how that lines up with the current share price.
Do you think there's more to the story for Wix.com? Head over to our Community to see what others are saying!
This article by Simply Wall St is general in nature. We provide commentary based on historical data and analyst forecasts only using an unbiased methodology and our articles are not intended to be financial advice. It does not constitute a recommendation to buy or sell any stock, and does not take account of your objectives, or your financial situation. We aim to bring you long-term focused analysis driven by fundamental data. Note that our analysis may not factor in the latest price-sensitive company announcements or qualitative material. Simply Wall St has no position in any stocks mentioned.
Valuation is complex, but we're here to simplify it.
Discover if Wix.com might be undervalued or overvalued with our detailed analysis, featuring fair value estimates, potential risks, dividends, insider trades, and its financial condition.
Access Free AnalysisHave feedback on this article? Concerned about the content? Get in touch with us directly. Alternatively, email editorial-team@simplywallst.com
About NasdaqGS:WIX
Wix.com
Operates a cloud-based web development platform for registered users and creators in the United States, Europe, Israel, and internationally.
High growth potential with slight risk.
Similar Companies
Market Insights


Advertisement
Weekly Picks
ST


stuart_roberts on Upside Gold ·
An Undervalued 3.3Moz Gold Project in Canada
Fair Value:CA$5.0774.4% undervalued
218 followersusers have followed this narrative
1 commentusers have commented on this narrative
31 likesusers have liked this narrative
SI


SimpleMan887 on GameStop ·
GameStop will ace the financial crisis wave with its strategic Bitcoin investment and cash reserves
Fair Value:US$22089.4% undervalued
55 followersusers have followed this narrative
2 commentsusers have commented on this narrative
21 likesusers have liked this narrative
YI

yiannisz on Hesai Group ·
The First Real Lidar Winner
Fair Value:US$27.0716.3% undervalued
14 followersusers have followed this narrative
1 commentusers have commented on this narrative
4 likesusers have liked this narrative
TR


tripledub on Taiwan Semiconductor Manufacturing ·
The Most Wonderful Monopoly in the Most Dangerous Neighbourhood on Earth
Fair Value:US$3812.7% undervalued
12 followersusers have followed this narrative
0 commentsusers have commented on this narrative
13 likesusers have liked this narrative
Recently Updated Narratives
TA


Talos on 5E Advanced Materials ·
5E Advanced Materials (FEAM): A Binary Critical Minerals Play with a $6.65 Fair Value Target
Fair Value:US$6.6577.4% undervalued
1 followerusers have followed this narrative
0 commentsusers have commented on this narrative
0 likesusers have liked this narrative
53

537578 on Recursion Pharmaceuticals ·
Recursion Pharmaceuticals! WTH is going on?
Fair Value:US$1.9766.5% overvalued
8 followersusers have followed this narrative
0 commentsusers have commented on this narrative
0 likesusers have liked this narrative
RO


Robbo on Visa ·
Visa and the Case for Patience in Premium Businesses
Fair Value:US$2808.7% overvalued
1 followerusers have followed this narrative
0 commentsusers have commented on this narrative
0 likesusers have liked this narrative
Popular Narratives
TR

tripledub on Microsoft ·
Everyone's Terrified Microsoft Will Keep Spending. I'm Terrified They'll Stop.
Fair Value:US$3956.1% undervalued
45 followersusers have followed this narrative
3 commentsusers have commented on this narrative
42 likesusers have liked this narrative
AN

AnalystConsensusTarget on Microsoft ·
Analyst Commentary Highlights Microsoft AI Momentum and Upward Valuation Amid Growth and Competitive Risks
Fair Value:US$587.3136.9% undervalued
1351 followersusers have followed this narrative
2 commentsusers have commented on this narrative
11 likesusers have liked this narrative
RO

Robbo on Tesla ·
The academically fascinating Tesla
Fair Value:US$301.1k% overvalued
37 followersusers have followed this narrative
11 commentsusers have commented on this narrative
31 likesusers have liked this narrative
Trending Discussion

EL

Element1 on Greatland Resources ·
I can’t believe how inaccurate and out of date this site is—and people rely on it. Greatland owns tw...
0
|0
MI

Mikeymike on Auxly Cannabis Group ·
Id like to understand why they believe the profit margin is going decline so dramatically. Is it ene...
0
|0