
Advertisement
- United States
- /
- Software
- /
- NasdaqGM:VERI
Veritone, Inc. (NASDAQ:VERI) Held Back By Insufficient Growth Even After Shares Climb 37%

Despite an already strong run, Veritone, Inc. (NASDAQ:VERI) shares have been powering on, with a gain of 37% in the last thirty days. Not all shareholders will be feeling jubilant, since the share price is still down a very disappointing 29% in the last twelve months.
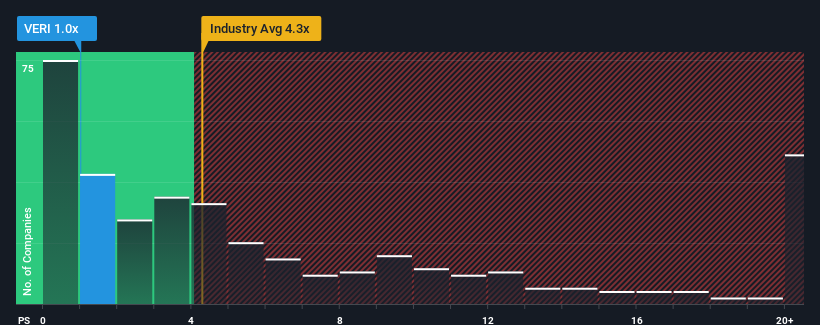
In spite of the firm bounce in price, Veritone may still look like a strong buying opportunity at present with its price-to-sales (or "P/S") ratio of 1x, considering almost half of all companies in the Software industry in the United States have P/S ratios greater than 4.3x and even P/S higher than 11x aren't out of the ordinary. However, the P/S might be quite low for a reason and it requires further investigation to determine if it's justified.
See our latest analysis for Veritone
How Has Veritone Performed Recently?
Veritone could be doing better as its revenue has been going backwards lately while most other companies have been seeing positive revenue growth. It seems that many are expecting the poor revenue performance to persist, which has repressed the P/S ratio. So while you could say the stock is cheap, investors will be looking for improvement before they see it as good value.
If you'd like to see what analysts are forecasting going forward, you should check out our free report on Veritone.Do Revenue Forecasts Match The Low P/S Ratio?
In order to justify its P/S ratio, Veritone would need to produce anemic growth that's substantially trailing the industry.
Retrospectively, the last year delivered a frustrating 15% decrease to the company's top line. Still, the latest three year period has seen an excellent 121% overall rise in revenue, in spite of its unsatisfying short-term performance. Accordingly, while they would have preferred to keep the run going, shareholders would definitely welcome the medium-term rates of revenue growth.
Turning to the outlook, the next three years should generate growth of 11% per annum as estimated by the three analysts watching the company. That's shaping up to be materially lower than the 15% per annum growth forecast for the broader industry.
With this information, we can see why Veritone is trading at a P/S lower than the industry. Apparently many shareholders weren't comfortable holding on while the company is potentially eyeing a less prosperous future.
What We Can Learn From Veritone's P/S?
Veritone's recent share price jump still sees fails to bring its P/S alongside the industry median. Generally, our preference is to limit the use of the price-to-sales ratio to establishing what the market thinks about the overall health of a company.
We've established that Veritone maintains its low P/S on the weakness of its forecast growth being lower than the wider industry, as expected. At this stage investors feel the potential for an improvement in revenue isn't great enough to justify a higher P/S ratio. Unless these conditions improve, they will continue to form a barrier for the share price around these levels.
We don't want to rain on the parade too much, but we did also find 3 warning signs for Veritone (2 don't sit too well with us!) that you need to be mindful of.
It's important to make sure you look for a great company, not just the first idea you come across. So if growing profitability aligns with your idea of a great company, take a peek at this free list of interesting companies with strong recent earnings growth (and a low P/E).
New: Manage All Your Stock Portfolios in One Place
We've created the ultimate portfolio companion for stock investors, and it's free.
• Connect an unlimited number of Portfolios and see your total in one currency
• Be alerted to new Warning Signs or Risks via email or mobile
• Track the Fair Value of your stocks
Have feedback on this article? Concerned about the content? Get in touch with us directly. Alternatively, email editorial-team (at) simplywallst.com.
This article by Simply Wall St is general in nature. We provide commentary based on historical data and analyst forecasts only using an unbiased methodology and our articles are not intended to be financial advice. It does not constitute a recommendation to buy or sell any stock, and does not take account of your objectives, or your financial situation. We aim to bring you long-term focused analysis driven by fundamental data. Note that our analysis may not factor in the latest price-sensitive company announcements or qualitative material. Simply Wall St has no position in any stocks mentioned.
About NasdaqGM:VERI
Veritone
Engages in the provision of artificial intelligence (AI) computing solutions and services in the United States, the United Kingdom, France, Australia, Israel, and India.
Good value slight.
Similar Companies
Market Insights

Advertisement
Community Narratives
WhiteCap Is Positioned To Profit Regardless Of Trump's Policy 
Fair Value CA$22.60|61.6% undervalued
ST
Equity Analyst and Writer
Microsoft's Evolution Will Drive Revenue to New Heights Fueled by AI
Fair Value US$360.00|29.9% overvalued
BR
Community Contributor
A CASE FOR USD$2.50 (CAD$3.44) BY 2028 (A 5-10 BAGGER)
Fair Value CA$3.44|87.8% undervalued
AG
Community Contributor