
Advertisement
- United States
- /
- Software
- /
- NasdaqCM:SPT
A Look At The Intrinsic Value Of Sprout Social, Inc. (NASDAQ:SPT)
Key Insights
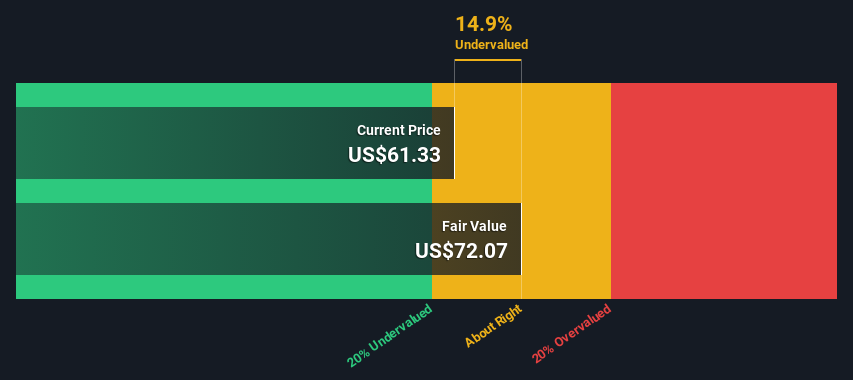
- Sprout Social's estimated fair value is US$72.07 based on 2 Stage Free Cash Flow to Equity
- With US$61.33 share price, Sprout Social appears to be trading close to its estimated fair value
- Analyst price target for SPT is US$70.02 which is 2.8% below our fair value estimate
Today we will run through one way of estimating the intrinsic value of Sprout Social, Inc. (NASDAQ:SPT) by taking the expected future cash flows and discounting them to their present value. We will use the Discounted Cash Flow (DCF) model on this occasion. Models like these may appear beyond the comprehension of a lay person, but they're fairly easy to follow.
We generally believe that a company's value is the present value of all of the cash it will generate in the future. However, a DCF is just one valuation metric among many, and it is not without flaws. If you still have some burning questions about this type of valuation, take a look at the Simply Wall St analysis model.
Check out our latest analysis for Sprout Social
Is Sprout Social Fairly Valued?
We are going to use a two-stage DCF model, which, as the name states, takes into account two stages of growth. The first stage is generally a higher growth period which levels off heading towards the terminal value, captured in the second 'steady growth' period. To start off with, we need to estimate the next ten years of cash flows. Where possible we use analyst estimates, but when these aren't available we extrapolate the previous free cash flow (FCF) from the last estimate or reported value. We assume companies with shrinking free cash flow will slow their rate of shrinkage, and that companies with growing free cash flow will see their growth rate slow, over this period. We do this to reflect that growth tends to slow more in the early years than it does in later years.
Generally we assume that a dollar today is more valuable than a dollar in the future, so we discount the value of these future cash flows to their estimated value in today's dollars:
10-year free cash flow (FCF) forecast
| 2024 | 2025 | 2026 | 2027 | 2028 | 2029 | 2030 | 2031 | 2032 | 2033 | |
| Levered FCF ($, Millions) | US$35.2m | US$60.9m | US$66.9m | US$72.0m | US$233.0m | US$246.9m | US$258.9m | US$269.4m | US$278.8m | US$287.5m |
| Growth Rate Estimate Source | Analyst x10 | Analyst x7 | Est @ 9.87% | Est @ 7.58% | Analyst x1 | Est @ 5.97% | Est @ 4.84% | Est @ 4.06% | Est @ 3.51% | Est @ 3.12% |
| Present Value ($, Millions) Discounted @ 7.2% | US$32.8 | US$52.9 | US$54.2 | US$54.4 | US$164 | US$162 | US$159 | US$154 | US$149 | US$143 |
("Est" = FCF growth rate estimated by Simply Wall St)
Present Value of 10-year Cash Flow (PVCF) = US$1.1b
After calculating the present value of future cash flows in the initial 10-year period, we need to calculate the Terminal Value, which accounts for all future cash flows beyond the first stage. The Gordon Growth formula is used to calculate Terminal Value at a future annual growth rate equal to the 5-year average of the 10-year government bond yield of 2.2%. We discount the terminal cash flows to today's value at a cost of equity of 7.2%.
Terminal Value (TV)= FCF2033 × (1 + g) ÷ (r – g) = US$288m× (1 + 2.2%) ÷ (7.2%– 2.2%) = US$5.9b
Present Value of Terminal Value (PVTV)= TV / (1 + r)10= US$5.9b÷ ( 1 + 7.2%)10= US$2.9b
The total value, or equity value, is then the sum of the present value of the future cash flows, which in this case is US$4.0b. To get the intrinsic value per share, we divide this by the total number of shares outstanding. Relative to the current share price of US$61.3, the company appears about fair value at a 15% discount to where the stock price trades currently. Valuations are imprecise instruments though, rather like a telescope - move a few degrees and end up in a different galaxy. Do keep this in mind.
Important Assumptions
We would point out that the most important inputs to a discounted cash flow are the discount rate and of course the actual cash flows. If you don't agree with these result, have a go at the calculation yourself and play with the assumptions. The DCF also does not consider the possible cyclicality of an industry, or a company's future capital requirements, so it does not give a full picture of a company's potential performance. Given that we are looking at Sprout Social as potential shareholders, the cost of equity is used as the discount rate, rather than the cost of capital (or weighted average cost of capital, WACC) which accounts for debt. In this calculation we've used 7.2%, which is based on a levered beta of 1.004. Beta is a measure of a stock's volatility, compared to the market as a whole. We get our beta from the industry average beta of globally comparable companies, with an imposed limit between 0.8 and 2.0, which is a reasonable range for a stable business.
SWOT Analysis for Sprout Social
Strength
- Cash in surplus of total debt.
Weakness
- Shareholders have been diluted in the past year.
Opportunity
- Has sufficient cash runway for more than 3 years based on current free cash flows.
- Current share price is below our estimate of fair value.
Threat
- Debt is not well covered by operating cash flow.
- Not expected to become profitable over the next 3 years.
Next Steps:
Whilst important, the DCF calculation shouldn't be the only metric you look at when researching a company. It's not possible to obtain a foolproof valuation with a DCF model. Rather it should be seen as a guide to "what assumptions need to be true for this stock to be under/overvalued?" If a company grows at a different rate, or if its cost of equity or risk free rate changes sharply, the output can look very different. For Sprout Social, we've compiled three fundamental elements you should further examine:
- Risks: For instance, we've identified 3 warning signs for Sprout Social (1 shouldn't be ignored) you should be aware of.
- Management:Have insiders been ramping up their shares to take advantage of the market's sentiment for SPT's future outlook? Check out our management and board analysis with insights on CEO compensation and governance factors.
- Other Solid Businesses: Low debt, high returns on equity and good past performance are fundamental to a strong business. Why not explore our interactive list of stocks with solid business fundamentals to see if there are other companies you may not have considered!
PS. The Simply Wall St app conducts a discounted cash flow valuation for every stock on the NASDAQCM every day. If you want to find the calculation for other stocks just search here.
New: Manage All Your Stock Portfolios in One Place
We've created the ultimate portfolio companion for stock investors, and it's free.
• Connect an unlimited number of Portfolios and see your total in one currency
• Be alerted to new Warning Signs or Risks via email or mobile
• Track the Fair Value of your stocks
Have feedback on this article? Concerned about the content? Get in touch with us directly. Alternatively, email editorial-team (at) simplywallst.com.
This article by Simply Wall St is general in nature. We provide commentary based on historical data and analyst forecasts only using an unbiased methodology and our articles are not intended to be financial advice. It does not constitute a recommendation to buy or sell any stock, and does not take account of your objectives, or your financial situation. We aim to bring you long-term focused analysis driven by fundamental data. Note that our analysis may not factor in the latest price-sensitive company announcements or qualitative material. Simply Wall St has no position in any stocks mentioned.
About NasdaqCM:SPT
Sprout Social
Designs, develops, and operates a web-based social media management platform in the Americas, Europe, the Middle East, Africa, and the Asia Pacific.
Undervalued with adequate balance sheet.
Similar Companies
Market Insights

Advertisement
Community Narratives
MicroVision will explode future revenue by 380.37% with a vision towards success
Fair Value US$60.00|98.4% undervalued
TH
Community Contributor
The Indispensable Artery for a New North American Economy
Fair Value CA$132.87|1.3% undervalued
TI
Community Contributor