- United States
- /
- Software
- /
- NasdaqGS:OPRA
Opera Limited's (NASDAQ:OPRA) Stock Has Been Sliding But Fundamentals Look Strong: Is The Market Wrong?


It is hard to get excited after looking at Opera's (NASDAQ:OPRA) recent performance, when its stock has declined 16% over the past three months. However, a closer look at its sound financials might cause you to think again. Given that fundamentals usually drive long-term market outcomes, the company is worth looking at. Specifically, we decided to study Opera's ROE in this article.
Return on equity or ROE is a key measure used to assess how efficiently a company's management is utilizing the company's capital. In short, ROE shows the profit each dollar generates with respect to its shareholder investments.
See our latest analysis for Opera
How Do You Calculate Return On Equity?
The formula for ROE is:
Return on Equity = Net Profit (from continuing operations) ÷ Shareholders' Equity
So, based on the above formula, the ROE for Opera is:
17% = US$153m ÷ US$902m (Based on the trailing twelve months to March 2024).
The 'return' is the profit over the last twelve months. One way to conceptualize this is that for each $1 of shareholders' capital it has, the company made $0.17 in profit.
What Is The Relationship Between ROE And Earnings Growth?
Thus far, we have learned that ROE measures how efficiently a company is generating its profits. Depending on how much of these profits the company reinvests or "retains", and how effectively it does so, we are then able to assess a company’s earnings growth potential. Generally speaking, other things being equal, firms with a high return on equity and profit retention, have a higher growth rate than firms that don’t share these attributes.
Opera's Earnings Growth And 17% ROE
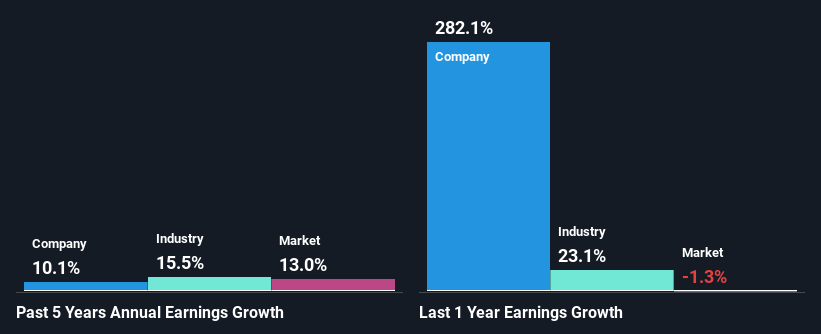
To begin with, Opera seems to have a respectable ROE. Especially when compared to the industry average of 13% the company's ROE looks pretty impressive. This probably laid the ground for Opera's moderate 10% net income growth seen over the past five years.
Next, on comparing with the industry net income growth, we found that Opera's reported growth was lower than the industry growth of 16% over the last few years, which is not something we like to see.
Earnings growth is an important metric to consider when valuing a stock. The investor should try to establish if the expected growth or decline in earnings, whichever the case may be, is priced in. Doing so will help them establish if the stock's future looks promising or ominous. Has the market priced in the future outlook for OPRA? You can find out in our latest intrinsic value infographic research report.
Is Opera Efficiently Re-investing Its Profits?
Opera has a healthy combination of a moderate three-year median payout ratio of 47% (or a retention ratio of 53%) and a respectable amount of growth in earnings as we saw above, meaning that the company has been making efficient use of its profits.
While Opera has seen growth in its earnings, it only recently started to pay a dividend. It is most likely that the company decided to impress new and existing shareholders with a dividend. Upon studying the latest analysts' consensus data, we found that the company's future payout ratio is expected to rise to 56% over the next three years. Accordingly, the expected increase in the payout ratio explains the expected decline in the company's ROE to 11%, over the same period.
Conclusion
Overall, we are quite pleased with Opera's performance. Specifically, we like that the company is reinvesting a huge chunk of its profits at a high rate of return. This of course has caused the company to see a good amount of growth in its earnings. With that said, the latest industry analyst forecasts reveal that the company's earnings growth is expected to slow down. To know more about the company's future earnings growth forecasts take a look at this free report on analyst forecasts for the company to find out more.
New: AI Stock Screener & Alerts
Our new AI Stock Screener scans the market every day to uncover opportunities.
• Dividend Powerhouses (3%+ Yield)
• Undervalued Small Caps with Insider Buying
• High growth Tech and AI Companies
Or build your own from over 50 metrics.
Have feedback on this article? Concerned about the content? Get in touch with us directly. Alternatively, email editorial-team (at) simplywallst.com.
This article by Simply Wall St is general in nature. We provide commentary based on historical data and analyst forecasts only using an unbiased methodology and our articles are not intended to be financial advice. It does not constitute a recommendation to buy or sell any stock, and does not take account of your objectives, or your financial situation. We aim to bring you long-term focused analysis driven by fundamental data. Note that our analysis may not factor in the latest price-sensitive company announcements or qualitative material. Simply Wall St has no position in any stocks mentioned.
About NasdaqGS:OPRA
Opera
Provides mobile and PC web browsers and related products and services in Norway and internationally.
Very undervalued with flawless balance sheet.
