Advertisement
- United States
- /
- Software
- /
- NasdaqGS:NBIS
Is Nebius Group’s Stock a Bargain After Its Sharp Pullback and AI Contract Wins?

Simply Wall St
Reviewed by Bailey Pemberton
- Thinking about whether Nebius Group stock is a hidden bargain or just flying high? You are not alone, as its eye-catching returns have many investors wondering if now is the time to tune in or sit out.
- After an impressive 235.0% rise year-to-date and a staggering 450.5% increase over the past year, Nebius Group has pulled back sharply, dropping 12.6% in the last week and 24.5% over the past month.
- These big swings come as the company grabbed headlines for securing several major AI infrastructure contracts, fueling speculation about future revenues but also raising questions about sustainability as competitors ramp up their own offerings. Recent market chatter has centered on Nebius Group's bold expansion moves and strategic partnerships in the cloud computing space.
- On our value radar, Nebius Group clocks in with a 2/6 valuation score, meaning it's currently undervalued on only 2 of our 6 standard checks. However, there is more to valuation than numbers alone. Let’s explore the usual methods and why the most insightful approach might just save you for last.
Nebius Group scores just 2/6 on our valuation checks. See what other red flags we found in the full valuation breakdown.
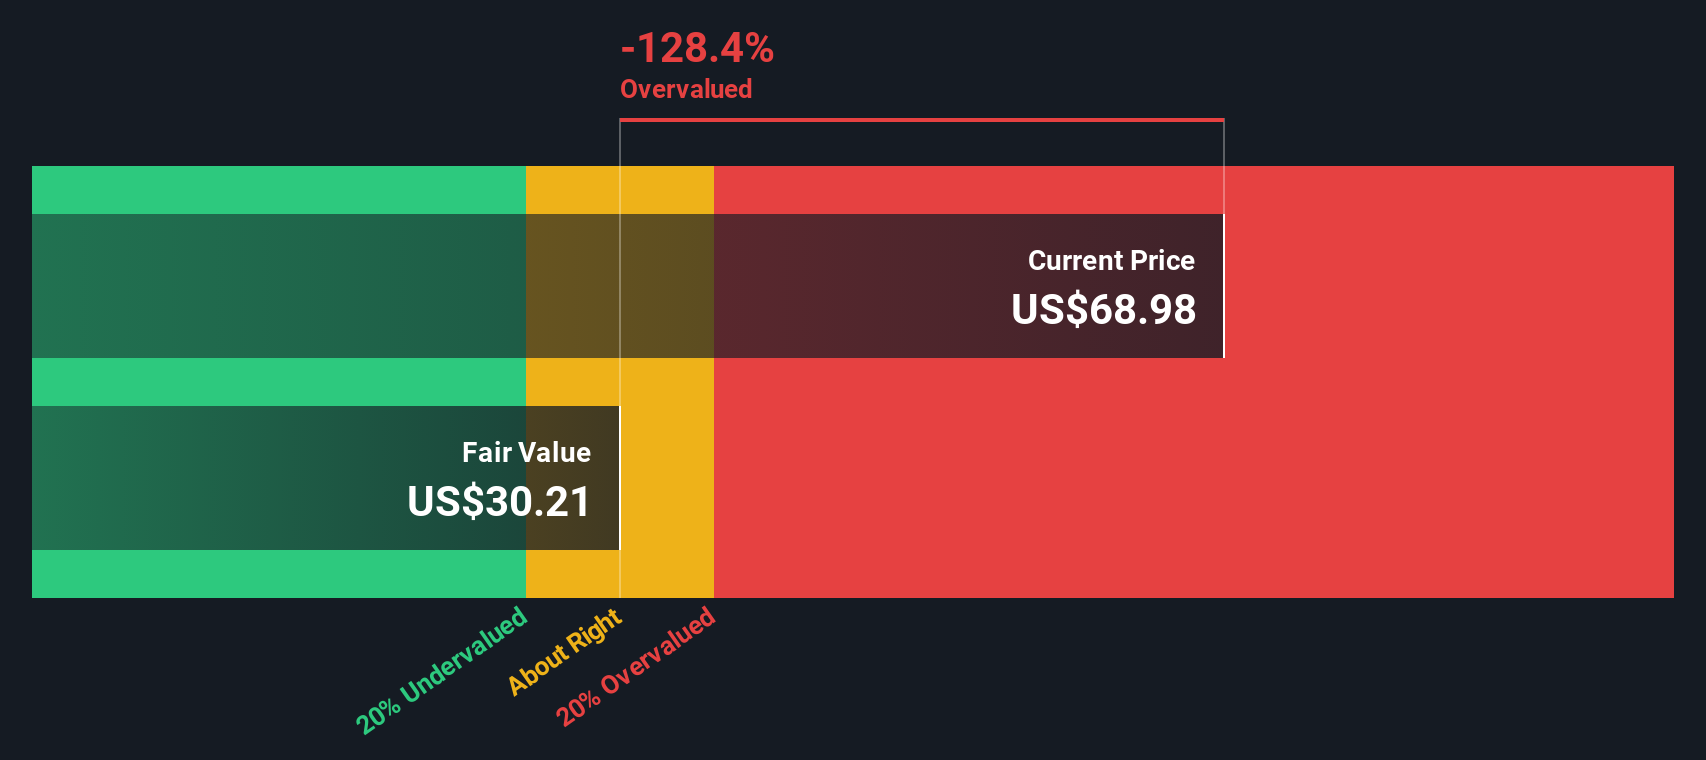
Approach 1: Nebius Group Discounted Cash Flow (DCF) Analysis
The Discounted Cash Flow (DCF) model estimates what a business is worth today by projecting its future cash flows and discounting them back to present value. For Nebius Group, this means looking at what the company is likely to generate in terms of cash, then translating that stream of dollars into today’s currency using reasonable assumptions.
Currently, Nebius Group reports Free Cash Flow (FCF) of -$658.8 million, meaning it is burning through cash as it invests in operations or expansion. Analyst estimates only reach about five years forward, but future projections, based on both analyst and Simply Wall St extrapolations, suggest a significant turnaround, with FCF growing to $3.79 billion by 2035. For example, projections see FCF climbing from -$7.42 billion in 2026 to a positive $767.1 million by 2029, marking a noteworthy trajectory into profitability over time.
Based on these cash flow forecasts, the DCF model calculates an intrinsic share value of $144.49, which is roughly 29.3% higher than the current market price. This model suggests that the market may be underestimating Nebius Group’s future earnings potential as it scales up and expands its revenues.
Result: UNDERVALUED
Our Discounted Cash Flow (DCF) analysis suggests Nebius Group is undervalued by 29.3%. Track this in your watchlist or portfolio, or discover 855 more undervalued stocks based on cash flows.
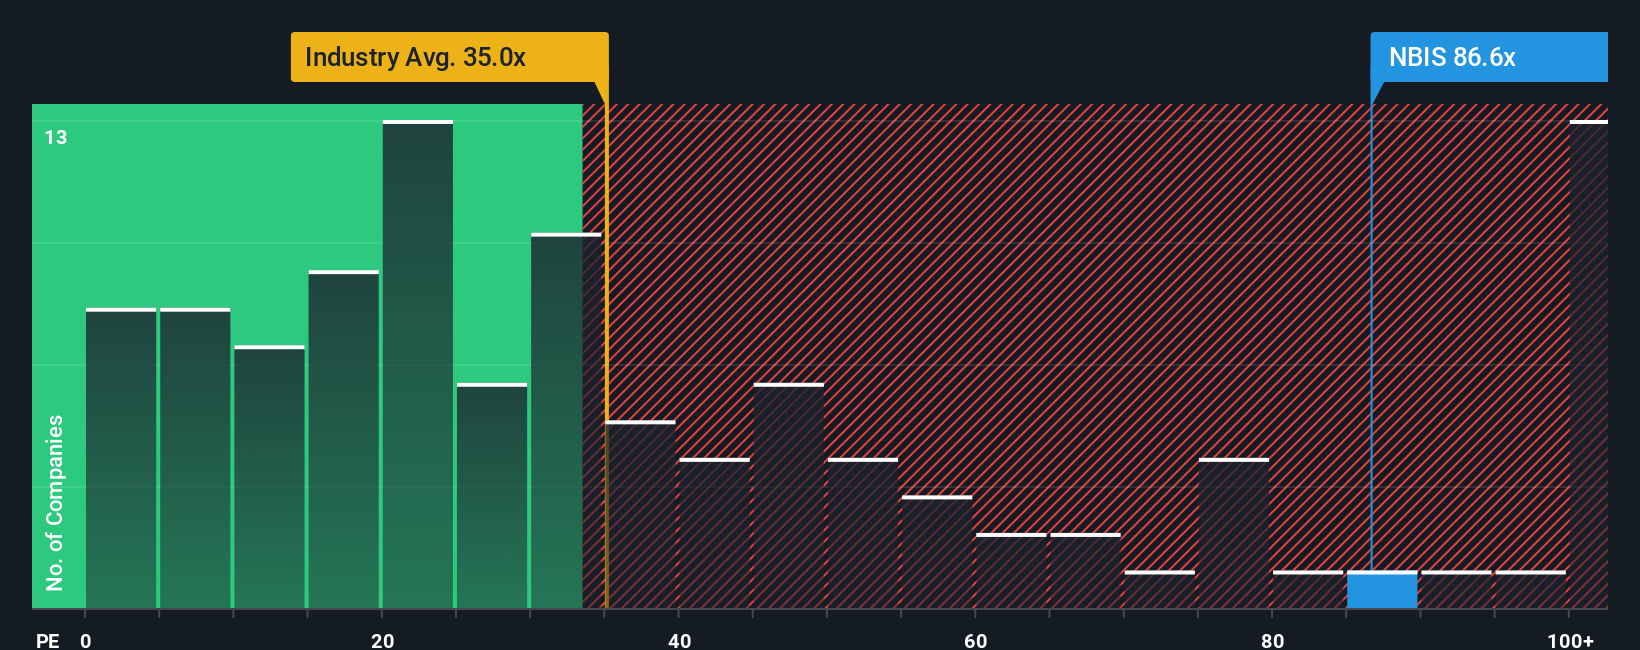
Approach 2: Nebius Group Price vs Earnings
Price-to-Earnings (PE) ratio is a widely recognized metric for valuing profitable companies because it directly relates a company's share price to its earnings per share. When a company generates meaningful profits, the PE ratio offers a direct and intuitive gauge of how much investors are paying for each dollar of profit. This is a key measure for comparing companies across an industry.
A "normal" or "fair" PE ratio depends on growth expectations, risk, and overall market sentiment. Higher growth companies usually command higher PE ratios, while firms exposed to more risk or slower growth tend to see lower multiples. Balancing these factors helps investors decide what they should be willing to pay for future earnings.
Nebius Group currently trades at a PE ratio of 135.3x. This is substantially above the software industry average of 32.5x and the peer group average of 27.0x. At first glance, this might suggest the stock is richly valued. However, these broad benchmarks overlook company-specific growth prospects, margins, and risk factors that can justify a higher ratio for the right business.
This is where Simply Wall St's "Fair Ratio" comes in. The Fair Ratio estimates a PE multiple that is appropriate for Nebius Group by considering its unique blend of earnings growth, profit margin, industry, market capitalization, and risk. Unlike peer or sector comparisons that give a one-size-fits-all answer, the Fair Ratio customizes the benchmark to the company’s real circumstances.
For Nebius Group, the Fair Ratio is calculated at 75.8x. With the current PE ratio at 135.3x, the stock’s multiple is considerably higher than what would be expected based on its fundamentals and risk profile. This indicates Nebius Group is overvalued using this approach.
Result: OVERVALUED
PE ratios tell one story, but what if the real opportunity lies elsewhere? Discover 1371 companies where insiders are betting big on explosive growth.
Upgrade Your Decision Making: Choose your Nebius Group Narrative
Earlier we mentioned that there is an even better way to understand valuation, so let's introduce you to Narratives. A Narrative is your unique story about Nebius Group. It’s how you link your expectations for its future revenues, earnings, and margins to a specific fair value, all grounded in your personal take on the business’s strengths and risks.
Instead of only relying on traditional financial ratios or analyst price targets, Narratives let you clearly describe why you think Nebius Group is worth more (or less) by connecting your research and beliefs directly to the numbers. On Simply Wall St’s Community page, you can easily write, publish, and compare Narratives with millions of investors worldwide, helping you decide when the stock is a buy or a sell based on your own assessment of fair value versus current price.
What makes Narratives even more powerful is that they evolve as the facts change. When new earnings, company news, or industry developments hit, Narratives update in real time, ensuring your investment thesis adapts as fast as Nebius Group’s story does. For example, some Nebius Group Narratives are highly bullish, setting fair value targets as high as $206 after the Microsoft contract, while more cautious perspectives put fair value as low as $47. This illustrates just how differently investors can view the same company depending on their assumptions and outlook.
Do you think there's more to the story for Nebius Group? Head over to our Community to see what others are saying!
This article by Simply Wall St is general in nature. We provide commentary based on historical data and analyst forecasts only using an unbiased methodology and our articles are not intended to be financial advice. It does not constitute a recommendation to buy or sell any stock, and does not take account of your objectives, or your financial situation. We aim to bring you long-term focused analysis driven by fundamental data. Note that our analysis may not factor in the latest price-sensitive company announcements or qualitative material. Simply Wall St has no position in any stocks mentioned.
Valuation is complex, but we're here to simplify it.
Discover if Nebius Group might be undervalued or overvalued with our detailed analysis, featuring fair value estimates, potential risks, dividends, insider trades, and its financial condition.
Access Free AnalysisHave feedback on this article? Concerned about the content? Get in touch with us directly. Alternatively, email editorial-team@simplywallst.com
About NasdaqGS:NBIS
Nebius Group
A technology company, engages in building full-stack infrastructure to service the global AI industry in the Netherlands, Europe, North America, and Israel.
Reasonable growth potential with imperfect balance sheet.
Similar Companies
Market Insights


Advertisement
Weekly Picks
ST


stuart_roberts on Unicycive Therapeutics ·
Looking to be second time lucky with a game-changing new product
Fair Value:US$21.5370.4% undervalued
36 followersusers have followed this narrative
0 commentsusers have commented on this narrative
5 likesusers have liked this narrative
HE

HegelBayeBagel on PlaySide Studios ·
PlaySide Studios: Market Is Sleeping on a Potential 10M+ Unit Breakout Year, FY26 Could Be the Rerate of the Decade
Fair Value:AU$0.8463.1% undervalued
10 followersusers have followed this narrative
2 commentsusers have commented on this narrative
7 likesusers have liked this narrative
AN


AnimalDoctorKwon on Inotiv ·
Inotiv NAMs Test Center
Fair Value:US$1.275.3% undervalued
20 followersusers have followed this narrative
2 commentsusers have commented on this narrative
6 likesusers have liked this narrative
TH

TheValueDetector on Cognyte Software ·
This isn’t speculation — this is confirmation.A Schedule 13G was filed, not a 13D, meaning this is passive institutional capital, not acti
Fair Value:US$95.6792.6% undervalued
29 followersusers have followed this narrative
2 commentsusers have commented on this narrative
5 likesusers have liked this narrative
Recently Updated Narratives
WE


WealthAP on Perion Network ·
Perion (PERI) Q4 Earnings: Real AI Turnaround… or Just Another Adtech Hype Cycle? 🤔📊
Fair Value:US$24.563.8% undervalued
1 followerusers have followed this narrative
0 commentsusers have commented on this narrative
0 likesusers have liked this narrative
MA

mattttyb on Taiwan Semiconductor Manufacturing ·
TSMC will drive future growth with CoWoS packaging and N2 rollout
Fair Value:US$45019.5% undervalued
1 followerusers have followed this narrative
0 commentsusers have commented on this narrative
0 likesusers have liked this narrative
CA


Canderous on PetroTal ·
Beyond 2026, Beyond a Double
Fair Value:CA$1.8178.2% undervalued
2 followersusers have followed this narrative
0 commentsusers have commented on this narrative
0 likesusers have liked this narrative
Popular Narratives
DA


davidlsander on Ubisoft Entertainment ·
Is Ubisoft the Market’s Biggest Pricing Error? Why Forensic Value Points to €33 Per Share
Fair Value:€33.887.4% undervalued
59 followersusers have followed this narrative
5 commentsusers have commented on this narrative
25 likesusers have liked this narrative
AN


AnalystConsensusTarget on Microsoft ·
Analyst Commentary Highlights Microsoft AI Momentum and Upward Valuation Amid Growth and Competitive Risks
Fair Value:US$59633.0% undervalued
1280 followersusers have followed this narrative
2 commentsusers have commented on this narrative
9 likesusers have liked this narrative
AN

AnalystConsensusTarget on NVIDIA ·
NVDA: Expanding AI Demand Will Drive Major Data Center Investments Through 2026
Fair Value:US$253.0225.7% undervalued
1077 followersusers have followed this narrative
6 commentsusers have commented on this narrative
32 likesusers have liked this narrative
Trending Discussion
TH
TheInvestingFool on PlaySide Studios ·
Looks interesting, I am jumping into the finances now. Your 15% margin seems high for a conservative model, can't just ignore the years they need to invest. You didnt seem to mention that they had to dilute the sharebase by issuing ~40mil shares. raising ~8 mil. should be enough if mouse does OK. If not they will need to raise more to suvive. Losing 20m a year, 14m after there 6m cutbacks. Am I reading it right that they have no debt. have they any history of raising debt? First look it is too dependant on the mouse and GoT games. they do well stock will 2-3x, poorly and it will drop. I am not sure I agree with your work for hire backstop. Unlikely meta horizons will continue with the same size contract going forward. say 10% margins and 15x multiple on 30m. that is 45m, which with the new sharecount is 10c. It is a backstop but maybe not that strong. Mouse fails and devs could start jumping ship and outside contracts could dry up. Hmm on top of all that AI could be disrupting the work for hire model. I think I have mostly talked myself out of it. Although Mouse looks good and does seem like the type of game that could go viral on twitch for a few months. If it does you will likly get a great return 5x plus. crap maybe I am talking myself back in.
1
|0
NE


nedbankluyolo93 on Nedbank Group ·
Nedbank please contact me,l need guidance step by step, please
0
|0
TH
TheValueDetector on Cognyte Software ·
CEO comp looks high on the surface, but context matters. Cognyte is approaching profitability — losses narrowed 23% YoY and they’re now guiding positive adjusted EBITDA of $47M for FY26. Revenue is growing 12-14% annually with a debt-free balance sheet. The board is compensating for execution on a turnaround, not rewarding stagnation. If they hit their $500M revenue / 20%+ EBITDA margin target by FY28, today’s comp will look like a bargain in hindsight. Imagine if everyone that has invested in Tesla 10 years ago had the same mentality...
0
|0