
Advertisement
- United States
- /
- Software
- /
- NasdaqGS:MSFT
These Fundamentals Suggest that Microsoft (NASDAQ:MSFT) Investors might be Overpaying on the Stock
What trends should we look for if we want to identify stocks that create value over the long term? We'd want to identify a growing return on capital employed (ROCE), an ever-increasing base of capital employed, and finally a cost of capital lower than the return. This shows us that the company is continually reinvesting its earnings back into the business and generates higher returns. So, here is what we found when we looked at the ROCE trend of Microsoft (NASDAQ:MSFT).
Understanding Return On Capital Employed (ROCE)
For those who don't know, ROCE is a measure of a company's yearly pre-tax profit (its return), relative to the capital employed in the business. Analysts use this formula to calculate it for Microsoft:
Return on Capital Employed = Earnings Before Interest and Tax (EBIT) ÷ (Total Assets - Current Liabilities)
0.29 = US$70b ÷ (US$334b - US$89b) (Based on the trailing twelve months to June 2021).
So, Microsoft has an ROCE of 29%. In absolute terms that's a great return and it's even better than the Software industry average of 10.0%.
Check out our latest analysis for Microsoft
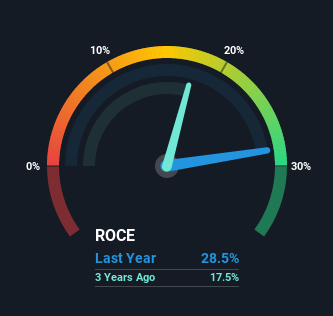
In the above chart we have measured Microsoft's prior ROCE against its prior performance, but the future is arguably more important. If you'd like to see what analysts are forecasting going forward, you should check out our free report for Microsoft.
So How Is Microsoft's ROCE Trending?
In the last five years, the returns generated on capital employed have grown from 17%, considerably to 29%. This implies that management is investing in some better projects and acquisitions.
The company is effectively making more money per dollar of capital used than it did three years ago, and it's worth noting that the amount of capital has increased too, by 82%.
Microsoft's Cost of Capital
When looking at the returns on capital employed, we get a better sense of the quality of the metric by comparing it to the cost of capital. If the return is greater than the cost, then we can argue that the company is creating value by making smart moves.
The cost of capital for Microsoft is 6.4%. Which is quite smaller than the return of 29%. This means that the company is creating excess returns of 22.6%!
This shows investors that the company is picking the right projects and maximizing their value. Further, this implies that the company has not exhausted its growth capacity and has room to sustain high growth rates before hitting full maturity - This is usually when the cost of capital converges to the return on capital and the company has difficulties finding profitable projects (or acquisitions).
For those that wonder what is the cost of capital and how we get it, here is the rough explanation. The cost of capital is the weighted average of the cost for the company to raise funds from both equity investors and lenders.
Weighted by what? Weighted by the market value of the equity in the company and the market value of the debt.
Great, now what is the cost of equity and the cost of debt?
The cost of equity is the return (in gains and dividends) that a company must offer investors for them buying the stock. Put simply, if the cost of equity is 7%, then MSFT's fundamentals need to have a basis to deliver at least 7% gains for you (the investor buying their stock).
Conversely, the cost of debt is the return a company needs to promise banks in order to secure loans or bond purchases. The cost of debt is the rate at which the company can borrow long term TODAY (not in the past). One major component of the cost of debt is the long term interest rate of the economy (a.k.a. the risk-free rate), which is why investors fear inflation - if the rates rise, so will the cost of debt jump for companies, and they will have fewer opportunities to raise cheap debt or to refinance existing obligations.
Now we have a better picture as to why the returns that are above the cost of capital create value, and returns that are lower than this, destroy value for shareholders. Therefore, Microsoft is a value creator by a large margin (21.6%)!
Implications for Company Value
With that being said, we use the free cash flows to equity investors to see if their sum, and their value in perpetuity, is worth the cost to buy MSFT shares. This is known as valuation and in our rough model we can see that MSFT is valued at US$417 per share, suggesting that the company is 28% undervalued.
Alternatively, if we take the cost of capital as an indicator, instead of just the cost of equity we get a different picture and value the company with a Free Cash Flow to Firm model at US$267 per share, implying that the company is overvalued by 12%.
Unfortunately, determining the intrinsic value of a company is complicated and there are rarely simple answers. Valuation relies on multiple assumptions about growth, profitability, risk, returns relative to costs, and interest rates as part of the cost of capital. But knowing the range of possibilities will help investors make better decisions in the market.
Key Takeaways
To sum it up, Microsoft has proven it can reinvest in the business and generate higher returns on that capital employed, which is terrific. And a remarkable 461% total return over the last five years tells us that investors are expecting more good things to come in the future.
Microsoft is still a value creating company, with the return on capital employed (29%) surpassing the cost of capital (6.4%).
The implication for value is a bit divergent. Best case - the stock is undervalued by 28%, and worst case, investors are overpaying by 12% for buying Microsoft shares.
On a separate note, we've found 2 warning signs for Microsoft you'll probably want to know about.
If you want to search for more stocks that have been earning high returns, check out this free list of stocks with solid balance sheets that are also earning high returns on equity.
New: Manage All Your Stock Portfolios in One Place
We've created the ultimate portfolio companion for stock investors, and it's free.
• Connect an unlimited number of Portfolios and see your total in one currency
• Be alerted to new Warning Signs or Risks via email or mobile
• Track the Fair Value of your stocks
Have feedback on this article? Concerned about the content? Get in touch with us directly. Alternatively, email editorial-team@simplywallst.com
Simply Wall St analyst Goran Damchevski and Simply Wall St have no position in any of the companies mentioned. This article is general in nature. We provide commentary based on historical data and analyst forecasts only using an unbiased methodology and our articles are not intended to be financial advice. It does not constitute a recommendation to buy or sell any stock and does not take account of your objectives, or your financial situation. We aim to bring you long-term focused analysis driven by fundamental data. Note that our analysis may not factor in the latest price-sensitive company announcements or qualitative material.
MI

The Foxhole
Nvidia's (NVDA) record profit had a US$7.8 billion catch. That chunk came from betting on its own customers, not from selling its chips.
137
JA

Jake_Merritt
The circularity worth examining is not the mark-to-market line. A large and growing share of Nvidia's revenue comes from companies funded by venture capital, and Nvidia participates in some of those rounds. That is the loop. The paper gains are just an accounting reflection of it, so focusing on them means arguing about the mirror rather than the room.
NA
nadia_y3d8i
Hyperscalers grew 13% sequentially, the other AI segment grew 25% and 138% year on year. The faster half is the funded half. AI venture funding was over 400 billion in the first half with about 70% spent on compute. That is an interesting composition shift like I mentioned yesterday.
 Andrew Legget
Market Insights
Great earnings season, but are the earnings real?

At first glance, this was the strongest earnings season in years. But when you look at where the growth actually came from, the story splits into two very different pictures.
00
GO

Goran Damchevski
Goran is an Equity Analyst and Writer at Simply Wall St with over 5 years of experience in financial analysis and company research. Goran previously worked in a seed-stage startup as a capital markets research analyst and product lead and developed a financial data platform for equity investors.
About NasdaqGS:MSFT
Microsoft
A technology company, develops and supports a portfolio of technology solutions for individuals and businesses worldwide.
Outstanding track record with flawless balance sheet and pays a dividend.
Similar Companies
Market Insights


Advertisement
Weekly Picks
LO


Lou_Basenese on Oncolytics Biotech ·
The Team Behind a $2 Billion Johnson & Johnson (JNJ) Deal Just Took Over This $105 Million Cancer Biotech
Fair Value:US$3.575.7% undervalued
22 followersusers have followed this narrative
0 commentsusers have commented on this narrative
7 likesusers have liked this narrative
TR


tripledub on Meta Platforms ·
The $135 Billion Bet That Should Make Every Shareholder Nervous
Fair Value:US$5862.5% undervalued
57 followersusers have followed this narrative
3 commentsusers have commented on this narrative
34 likesusers have liked this narrative
TA


Talos on Voyager Technologies ·
The "Landlord of Orbit" – A Deep Value Play Ahead of the Starlab Era
Fair Value:US$385.291.0% undervalued
55 followersusers have followed this narrative
0 commentsusers have commented on this narrative
6 likesusers have liked this narrative
IV

Ivoed on Uber Technologies ·
Uber’s Valuation Depends On Who Captures The Economics Of Driverless Rides
Fair Value:US$11633.7% undervalued
12 followersusers have followed this narrative
0 commentsusers have commented on this narrative
3 likesusers have liked this narrative
Recently Updated Narratives
ES

Ester on Sorento Capital Berhad ·
Sorento Capital Berhad: Earnings Strengthened by Margin Expansion and Cost Discipline
Fair Value:RM 0.8826.1% undervalued
1 followerusers have followed this narrative
0 commentsusers have commented on this narrative
0 likesusers have liked this narrative
ZD


Zdend on Flex ·
From Circuit Boards to AI Power Grids: The Unstoppable Transformation of Flex
Fair Value:US$130.2611.5% undervalued
2 followersusers have followed this narrative
0 commentsusers have commented on this narrative
0 likesusers have liked this narrative
TO

TomW6 on Salesforce ·
Salesforce's Market Dominance and AI Pivot Will Drive Earnings Re-acceleration
Fair Value:US$330.0323.6% undervalued
7 followersusers have followed this narrative
0 commentsusers have commented on this narrative
0 likesusers have liked this narrative
Popular Narratives
OS


oscargarcia on NVIDIA ·
The company that went from selling GPUs to gamers to becoming the AI arms dealer of the 21st century.
Fair Value:US$28018.6% undervalued
366 followersusers have followed this narrative
9 commentsusers have commented on this narrative
16 likesusers have liked this narrative
CU

CubanEros on Microsoft ·
A wonderful business at reasonable price.
Fair Value:US$419.9120.3% overvalued
213 followersusers have followed this narrative
0 commentsusers have commented on this narrative
9 likesusers have liked this narrative
KI

KiwiInvest on Amazon.com ·
Amazon's high growth, high tech segments propel its profits, while traditional segments plod along
Fair Value:US$475.0946.1% undervalued
236 followersusers have followed this narrative
1 commentusers have commented on this narrative
8 likesusers have liked this narrative


