Advertisement
- United States
- /
- Software
- /
- NasdaqGS:MSFT
Is Microsoft (MSFT) Still Reasonably Priced After Its Strong Multi Year Share Price Run

Reviewed by Bailey Pemberton
- If you are wondering whether Microsoft is still fairly priced after its long run, or if there is value left on the table, it helps to start by looking at what recent returns and current valuation are actually telling you.
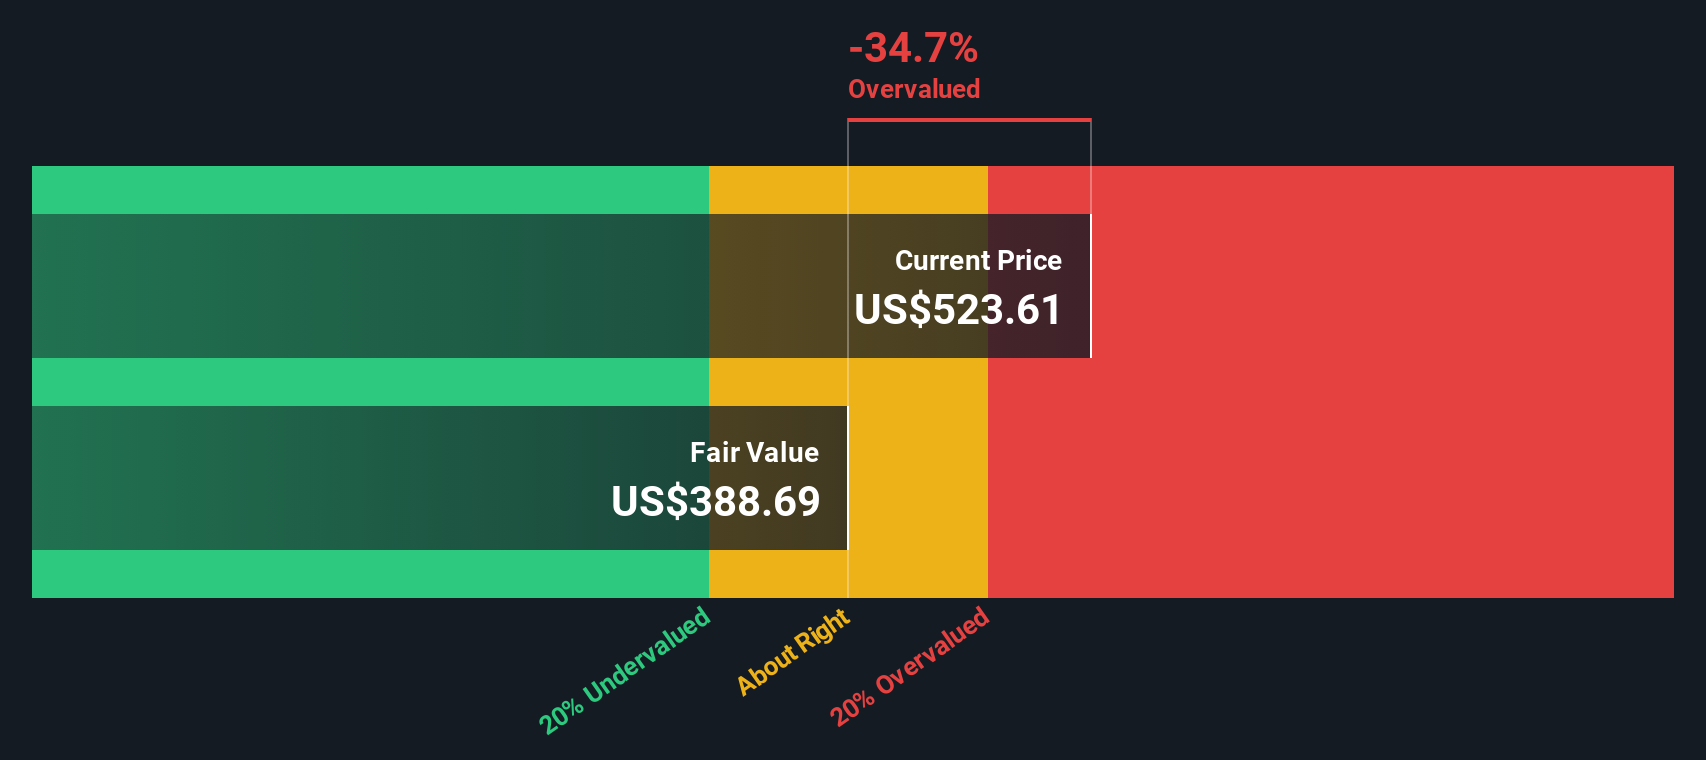
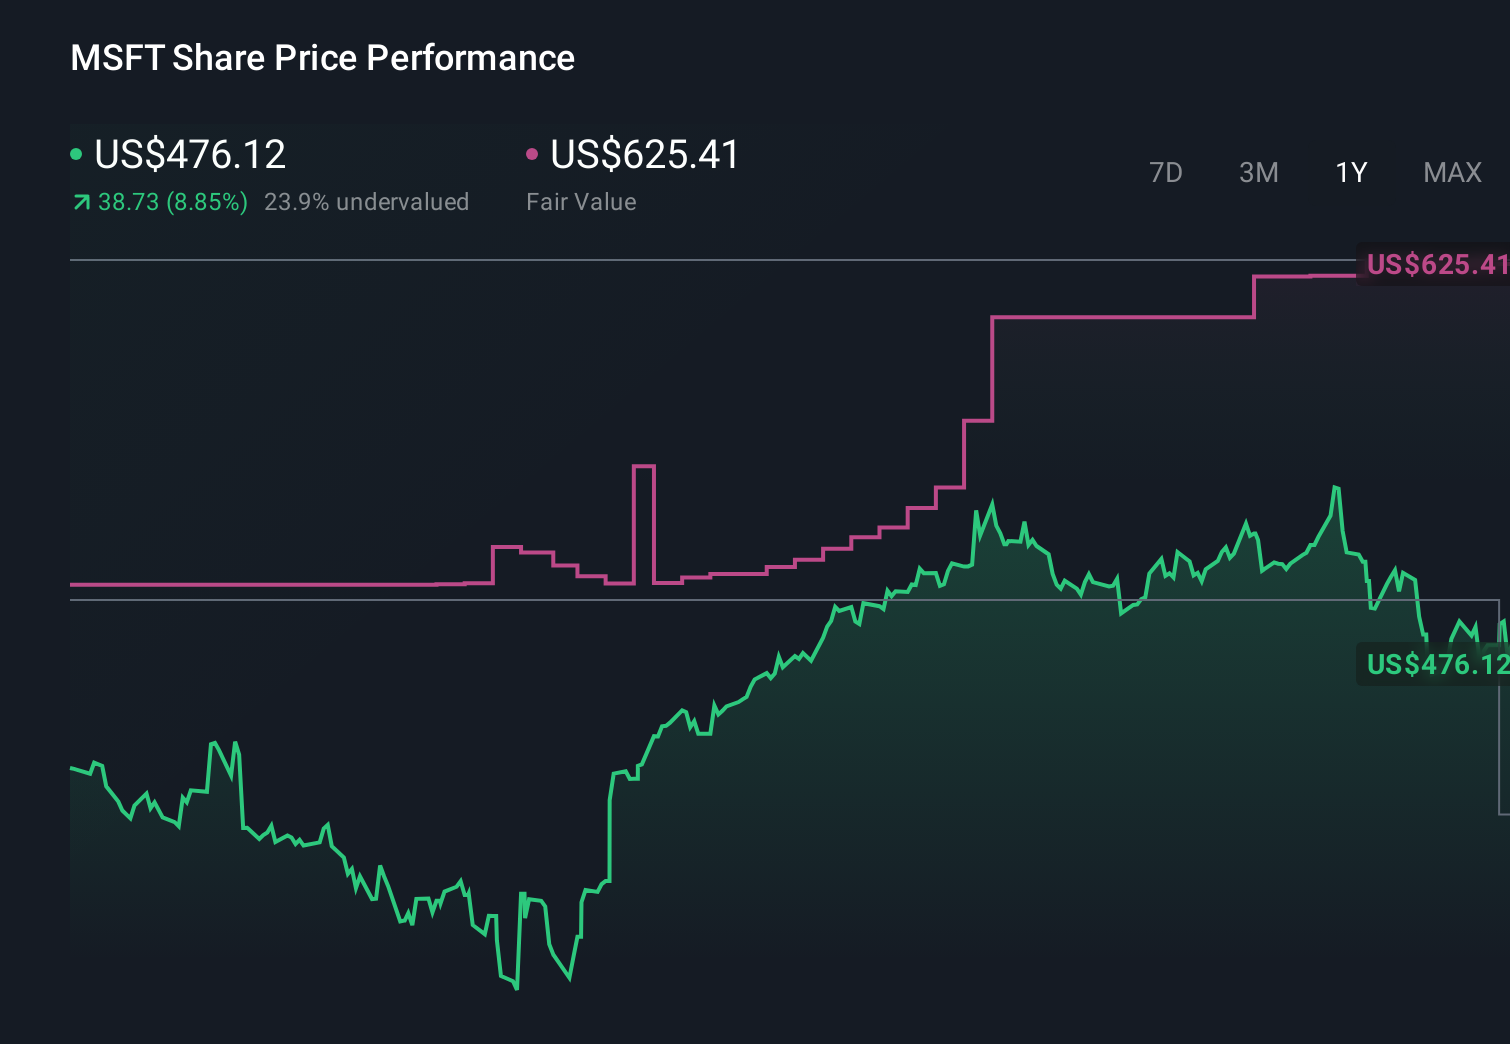
- The stock last closed at US$470.28, with returns of 2.3% over 7 days, a 3.6% decline over 30 days, a 0.6% decline year to date, 9.0% over 1 year, 98.4% over 3 years, and 104.5% over 5 years. Taken together, these figures set the backdrop for any discussion about upside or risk.
- Recent news coverage around Microsoft has largely centered on its role as a core large cap software name and its position in major technology themes. This keeps attention on how the stock is priced relative to expectations built into those stories. That context matters because shifting sentiment around those themes can quickly influence how investors think about paying up for quality, stability, or growth potential in the share price.
- On our checks, Microsoft currently has a valuation score of 4 out of 6, which means it screens as undervalued on four of six measures. Below, we break down how different valuation approaches arrive at that view and then outline a framework that can help you read these signals more effectively.
Approach 1: Microsoft Discounted Cash Flow (DCF) Analysis
A Discounted Cash Flow model takes estimates of a company’s future cash flows, then discounts them back to today’s dollars to arrive at an estimate of what the business might be worth right now.
For Microsoft, the model used here is a 2 Stage Free Cash Flow to Equity approach based on cash flow projections. The latest twelve month free cash flow is about $89.4b. Analysts provide explicit forecasts for the next few years, and Simply Wall St then extrapolates those out further, with projected free cash flow reaching roughly $207.3b in 2030.
When all those future cash flows are discounted back and added up, the model arrives at an estimated intrinsic value of about $607.31 per share. Compared with the recent share price of $470.28, this implies a 22.6% discount, which points to Microsoft trading below this particular estimate of fair value.
Result: UNDERVALUED
Our Discounted Cash Flow (DCF) analysis suggests Microsoft is undervalued by 22.6%. Track this in your watchlist or portfolio, or discover 885 more undervalued stocks based on cash flows.
Approach 2: Microsoft Price vs Earnings
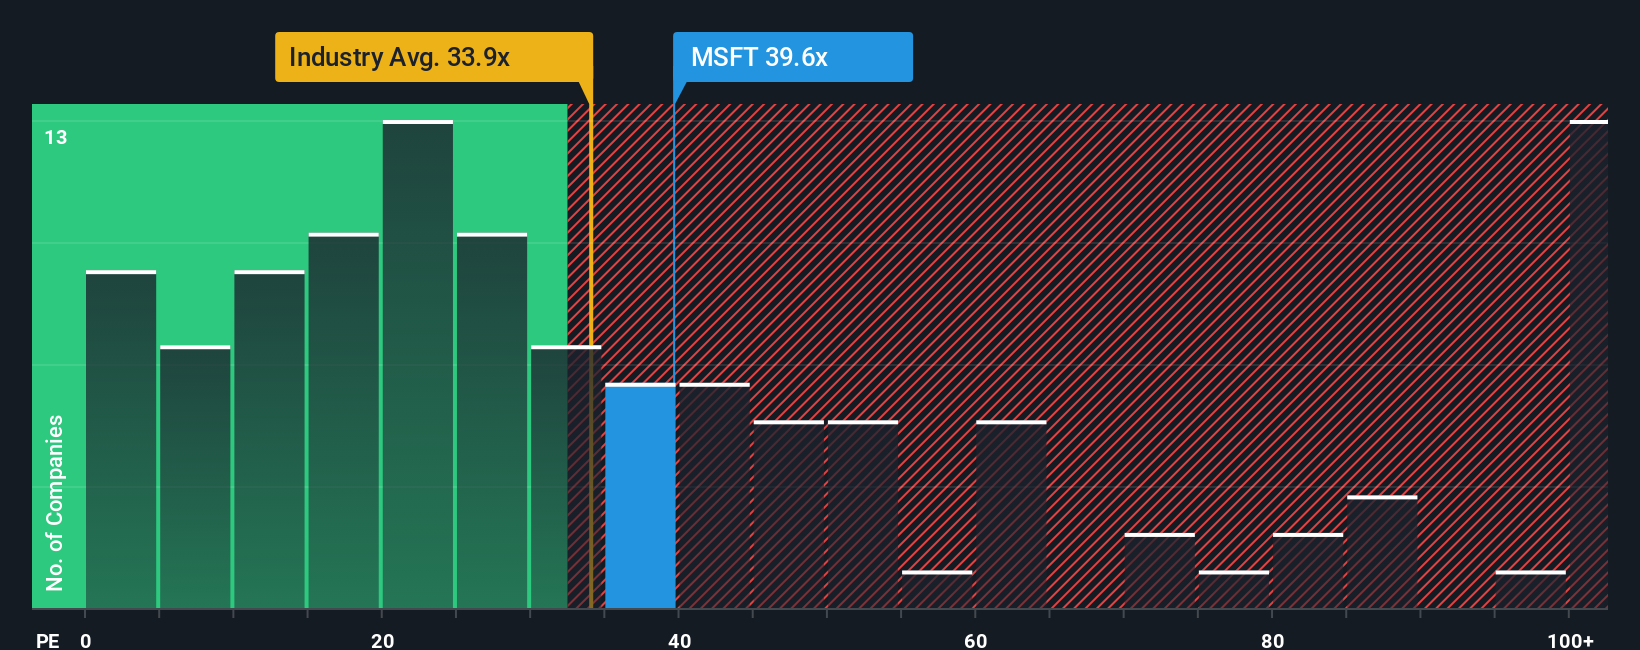
For a consistently profitable company, the P/E ratio is a useful shorthand for how much investors are paying for each dollar of earnings. It gives you a quick sense of how the market weighs the company’s earnings power relative to other options.
What counts as a “normal” P/E depends on what investors expect from future growth and how much risk they see in those earnings. Higher expected growth or lower perceived risk can justify a higher multiple, while slower growth or higher uncertainty usually points to a lower one.
Microsoft currently trades on a P/E of 33.32x. That sits above the Software industry average of 30.76x and the peer average of 32.20x, which suggests the market is willing to pay a premium compared with many similar names.
Simply Wall St’s Fair Ratio is a proprietary estimate of what P/E might be reasonable for Microsoft, given factors like its earnings growth profile, margins, industry, market cap and company specific risks. This tailored yardstick is often more informative than a simple comparison with peers or sector averages because it aligns the multiple with the company’s own fundamentals rather than broad group averages.
Here, Microsoft’s Fair Ratio is 51.17x, materially above the current 33.32x P/E. This points to the shares trading below this Fair Ratio based view of value.
Result: UNDERVALUED
P/E ratios tell one story, but what if the real opportunity lies elsewhere? Discover 1425 companies where insiders are betting big on explosive growth.
Upgrade Your Decision Making: Choose your Microsoft Narrative
Earlier we mentioned that there is an even better way to understand valuation, so let us introduce you to Narratives, a simple way for you to connect your view of Microsoft’s story with your own numbers on future revenue, earnings, margins and fair value.
A Narrative is your version of the company’s story, translated into a forecast and then into a fair value that you can compare directly with today’s share price. This helps you quickly see whether your view suggests Microsoft is over or under your own estimate of worth.
On Simply Wall St, Narratives sit inside the Community page and are used by millions of investors. They give you an easy tool where your assumptions flow straight into a forecast model that updates automatically when new information such as earnings releases or major news is added.
For Microsoft, one Narrative might assume stronger revenue growth and higher long term profit margins, while another might assume slower growth and more modest margins. This leads to very different fair values and helps each investor decide whether the current price feels attractive or expensive on their terms.
Do you think there's more to the story for Microsoft? Head over to our Community to see what others are saying!
This article by Simply Wall St is general in nature. We provide commentary based on historical data and analyst forecasts only using an unbiased methodology and our articles are not intended to be financial advice. It does not constitute a recommendation to buy or sell any stock, and does not take account of your objectives, or your financial situation. We aim to bring you long-term focused analysis driven by fundamental data. Note that our analysis may not factor in the latest price-sensitive company announcements or qualitative material. Simply Wall St has no position in any stocks mentioned.
New: Manage All Your Stock Portfolios in One Place
We've created the ultimate portfolio companion for stock investors, and it's free.
• Connect an unlimited number of Portfolios and see your total in one currency
• Be alerted to new Warning Signs or Risks via email or mobile
• Track the Fair Value of your stocks
Have feedback on this article? Concerned about the content? Get in touch with us directly. Alternatively, email editorial-team@simplywallst.com
About NasdaqGS:MSFT
Microsoft
Develops and supports software, services, devices, and solutions worldwide.
Outstanding track record with flawless balance sheet and pays a dividend.
Similar Companies
Market Insights


Advertisement
Weekly Picks
ST


stuart_roberts on Upside Gold ·
An Undervalued 3.3Moz Gold Project in Canada
Fair Value:CA$5.0775.1% undervalued
139 followersusers have followed this narrative
1 commentusers have commented on this narrative
22 likesusers have liked this narrative
YA

Yang_ on SoFi Technologies ·
SoFi Technologies: The Apex Aggregator and the Infrastructure of the Modern Financial System
Fair Value:US$22.9822.7% undervalued
44 followersusers have followed this narrative
0 commentsusers have commented on this narrative
33 likesusers have liked this narrative
KO

Kouj on CSL ·
CSL: The Dip Is the Opportunity
Fair Value:AU$1559.3% undervalued
19 followersusers have followed this narrative
0 commentsusers have commented on this narrative
15 likesusers have liked this narrative
GA

GavrielH on DHT Holdings ·
DHT Holdings, inc: Strait of Hormuz Risk Amidst US-Israel vs Iran Tensions Spikes VLCC Rates.
Fair Value:US$3653.2% undervalued
15 followersusers have followed this narrative
0 commentsusers have commented on this narrative
9 likesusers have liked this narrative
Recently Updated Narratives
VE

Vestra on Costco Wholesale ·
Costco Wholesale Corp (COST): Operational Moats and the Membership Flywheel
Fair Value:US$1.09k7.1% undervalued
3 followersusers have followed this narrative
0 commentsusers have commented on this narrative
0 likesusers have liked this narrative
VE

Vestra on Alibaba Group Holding ·
Alibaba Group Holding Ltd (BABA): The Agentic AI Shift and "OpenClaw" Transformation
Fair Value:US$199.6132.3% undervalued
5 followersusers have followed this narrative
0 commentsusers have commented on this narrative
0 likesusers have liked this narrative
VE

Vestra on Boeing ·
Boeing Co (BA): Operational Stabilization and the "Rate Break" Recovery
Fair Value:US$251.416.5% undervalued
1 followerusers have followed this narrative
0 commentsusers have commented on this narrative
0 likesusers have liked this narrative
Popular Narratives
KA

kabz2342 on Nu Holdings ·
Nu holdings will continue to disrupt the South American banking market
Fair Value:US$64.378.4% undervalued
53 followersusers have followed this narrative
3 commentsusers have commented on this narrative
29 likesusers have liked this narrative
YA
Yang_ on SoFi Technologies ·
SoFi Technologies: The Apex Aggregator and the Infrastructure of the Modern Financial System
Fair Value:US$22.9822.7% undervalued
44 followersusers have followed this narrative
0 commentsusers have commented on this narrative
33 likesusers have liked this narrative
AN


AnalystConsensusTarget on Microsoft ·
Analyst Commentary Highlights Microsoft AI Momentum and Upward Valuation Amid Growth and Competitive Risks
Fair Value:US$59633.6% undervalued
1310 followersusers have followed this narrative
2 commentsusers have commented on this narrative
10 likesusers have liked this narrative
Trending Discussion


DA

daqui_luis on Corticeira Amorim S.G.P.S ·
Great analysis on a great and solid company with a dominant position in the Cork Market.
1
|0
