Advertisement
- United States
- /
- Software
- /
- NasdaqGS:MNDY
Is monday.com’s Drop After New AI Launch a Chance or Just Hype in 2025?

Simply Wall St
Reviewed by Bailey Pemberton
- Wondering if monday.com stock is actually a bargain or just riding the hype? You are not alone. Getting the value call right now could make a real difference for your portfolio.
- The stock has seen some turbulence lately, falling 3.7% over the last week and dipping 17.7% over the past month. It has posted a sharp 33.7% decline year-to-date and a 41.1% drop over the past year, yet it still stands 54.0% higher than three years ago.
- Recent price swings in monday.com’s stock have drawn extra attention after news of its new AI-powered product launches and expanded partnerships. Some analysts see this as a bold push to reignite growth. Meanwhile, ongoing investor debates about the competitive landscape and technology valuations add another layer of intrigue to recent moves.
- If you are reviewing the numbers, note that monday.com currently scores a 3 out of 6 on our valuation checks. Let us break down some core approaches that investors use to judge value, and stay tuned for a look at a smarter way to put all the pieces together by the end of the article.
Find out why monday.com's -41.1% return over the last year is lagging behind its peers.
Approach 1: monday.com Discounted Cash Flow (DCF) Analysis
A Discounted Cash Flow (DCF) model estimates a company's intrinsic value by projecting its future cash flows and discounting them back to today's value. This approach relies on the idea that a dollar today is worth more than a dollar tomorrow due to opportunity cost and risk.
For monday.com, analysts estimate that the company generated $331 million in Free Cash Flow over the last twelve months. In the coming years, growth is expected to accelerate, with projections rising from $405 million in 2026 to as high as $1.2 billion by 2035. While analyst forecasts typically extend five years, further projections, such as those used here, are analytically extrapolated to cover a full decade into the future.
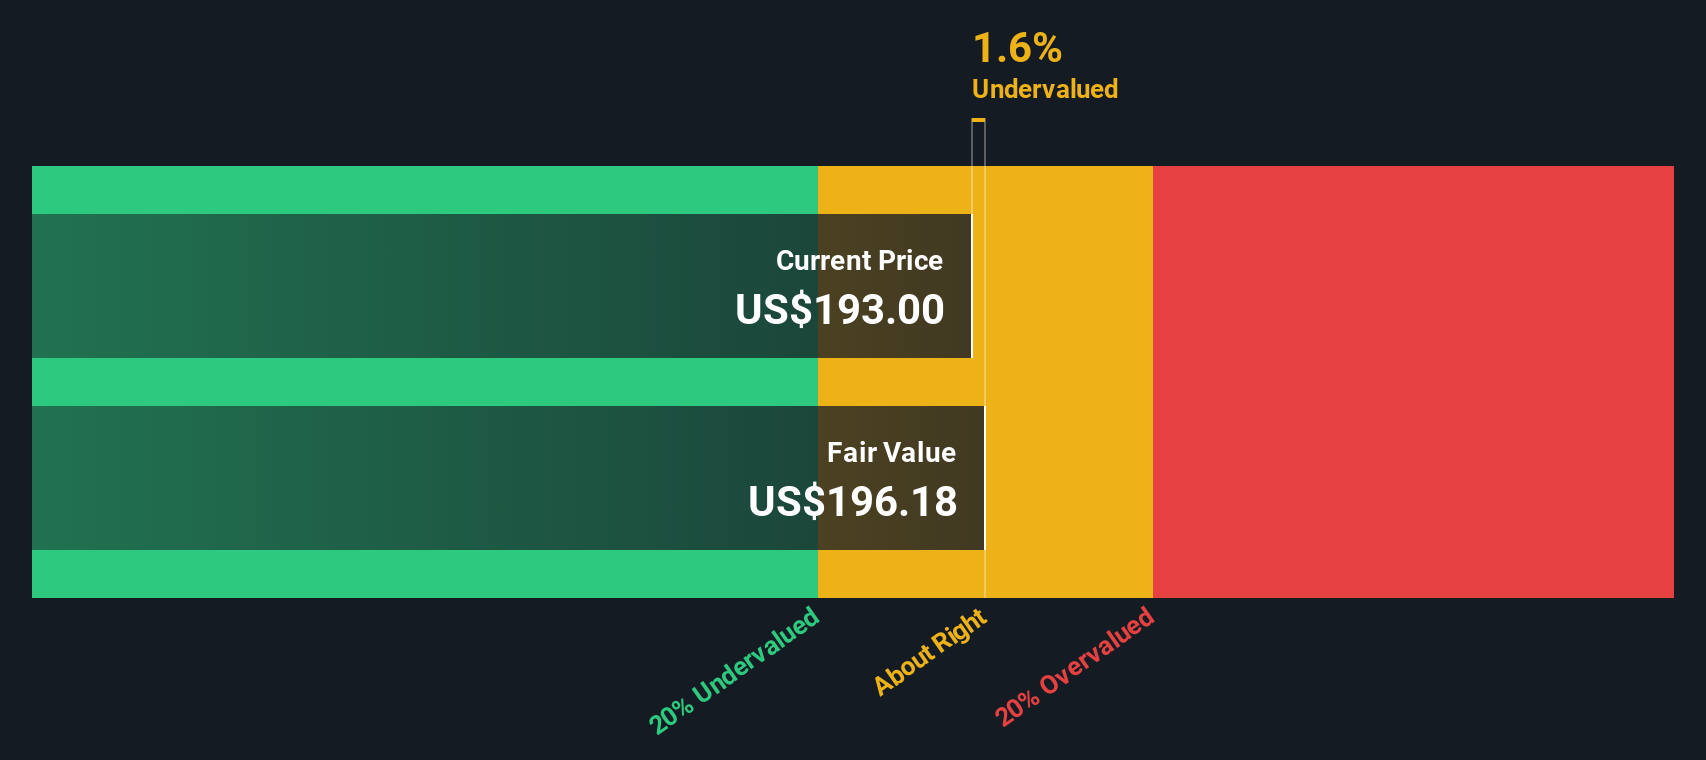
After running the numbers through a 2 Stage Free Cash Flow to Equity model, monday.com’s estimated intrinsic or "fair" value comes in at $211.76 per share. This figure is about 27.7% above the current trading price, suggesting the stock may be undervalued by the market.
Result: UNDERVALUED
Our Discounted Cash Flow (DCF) analysis suggests monday.com is undervalued by 27.7%. Track this in your watchlist or portfolio, or discover 905 more undervalued stocks based on cash flows.
Approach 2: monday.com Price vs Earnings
The Price-to-Earnings (PE) ratio stands out as a go-to valuation tool for companies that are generating consistent profits, like monday.com. It provides a straightforward way to see how much investors are willing to pay per dollar of earnings, making it especially handy for evaluating software businesses that have reached profitability.
It's important to remember that not all PE ratios are created equal. Higher growth expectations and lower perceived risks typically justify a higher PE ratio, while slower-growing or riskier firms usually trade at lower multiples. This is why simply comparing PE ratios without context can sometimes be misleading.
As of now, monday.com is trading at a PE ratio of 121.4x. That is much higher than the Software industry average of 30.0x and also above its peer group average of 36.4x. On the surface, this suggests the market is expecting significant future growth from the company.
This is where Simply Wall St’s “Fair Ratio” comes into play. Unlike basic industry or peer comparisons, the Fair Ratio is tailored based on a company’s own profile, including factors like earnings growth, profitability, market cap, and risk. For monday.com, this Fair PE Ratio is 46.5x, which is much lower than its current multiple. This implies the stock is above what would be considered a reasonable valuation after accounting for these specific factors.
Based on this comparison, monday.com’s shares appear to be trading at a premium to their calculated Fair Ratio.
Result: OVERVALUED

PE ratios tell one story, but what if the real opportunity lies elsewhere? Discover 1416 companies where insiders are betting big on explosive growth.
Upgrade Your Decision Making: Choose your monday.com Narrative
Earlier we mentioned that there is an even better way to understand valuation, so let us introduce you to Narratives. A Narrative is your personal investment story for a company, where you connect your view of its future—such as estimates for revenue, profit margins, and fair value—to actual financial forecasts and compare those to the current price.
Narratives help you see how a company's story translates directly into numbers, making it easier to decide if now is the right time to buy, hold, or sell. On Simply Wall St's Community page, you can use Narratives as an intuitive tool adopted by millions of investors. These are not static forecasts either. Your Narrative dynamically updates as new news, earnings, or market shifts occur, so your fair value remains relevant.
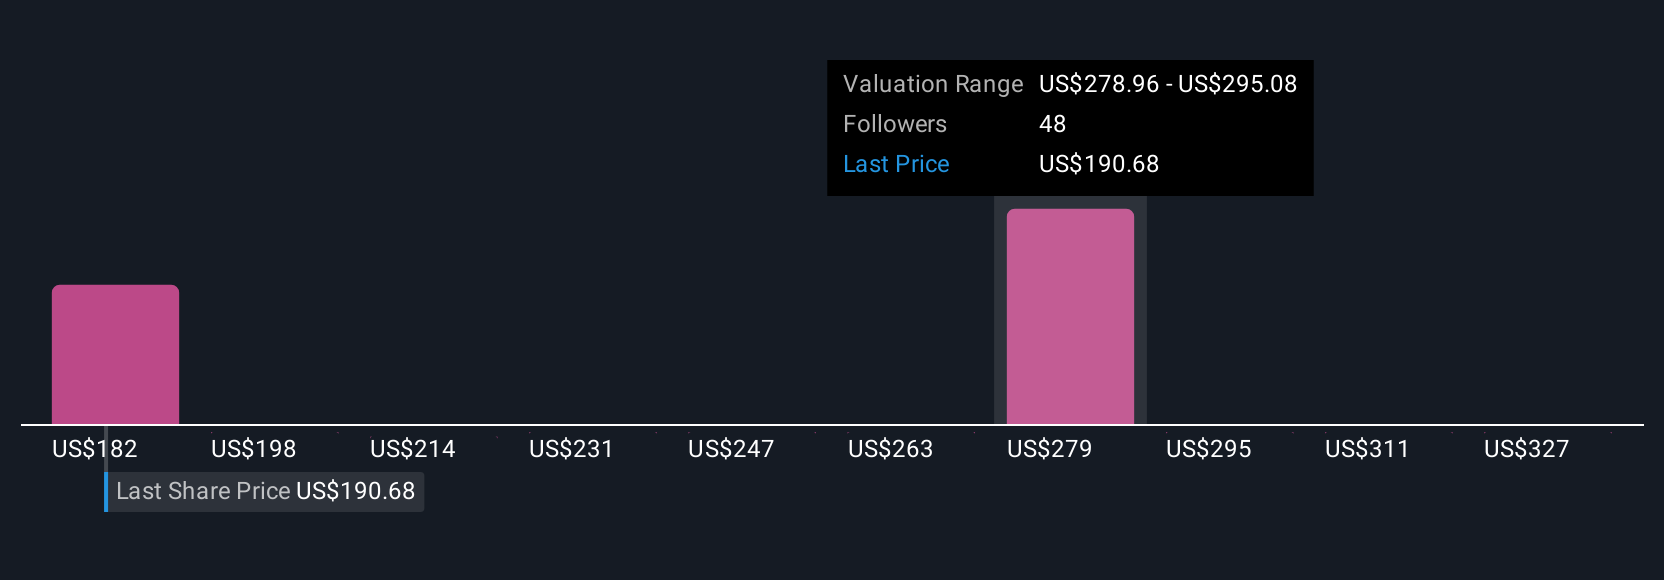
For example, with monday.com, one investor might build a bullish Narrative based on enterprise momentum and product innovation, leading to a high fair value of $450 per share. Another, more cautious Narrative might focus on competitive threats and market headwinds, resulting in a much lower fair value of $205. By comparing your chosen Narrative's fair value directly to the latest share price, you can make smarter, more personal investment decisions in a fast-changing market.
Do you think there's more to the story for monday.com? Head over to our Community to see what others are saying!
This article by Simply Wall St is general in nature. We provide commentary based on historical data and analyst forecasts only using an unbiased methodology and our articles are not intended to be financial advice. It does not constitute a recommendation to buy or sell any stock, and does not take account of your objectives, or your financial situation. We aim to bring you long-term focused analysis driven by fundamental data. Note that our analysis may not factor in the latest price-sensitive company announcements or qualitative material. Simply Wall St has no position in any stocks mentioned.
New: AI Stock Screener & Alerts
Our new AI Stock Screener scans the market every day to uncover opportunities.
• Dividend Powerhouses (3%+ Yield)
• Undervalued Small Caps with Insider Buying
• High growth Tech and AI Companies
Or build your own from over 50 metrics.
Have feedback on this article? Concerned about the content? Get in touch with us directly. Alternatively, email editorial-team@simplywallst.com
About NasdaqGS:MNDY
monday.com
Develops software applications in the United States, Europe, the Middle East, Africa, the United Kingdom, and internationally.
Flawless balance sheet with solid track record.
Similar Companies
Market Insights

Advertisement
Community Narratives
MicroVision will explode future revenue by 380.37% with a vision towards success
Fair Value US$60.00|98.4% undervalued
TH
Community Contributor
The Indispensable Artery for a New North American Economy
Fair Value CA$132.87|1.3% undervalued
TI
Community Contributor