
Advertisement
- United States
- /
- Software
- /
- NasdaqGS:MANH
How Does Manhattan Associates's (NASDAQ:MANH) P/E Compare To Its Industry, After The Share Price Drop?
Unfortunately for some shareholders, the Manhattan Associates (NASDAQ:MANH) share price has dived 42% in the last thirty days. Even longer term holders have taken a real hit with the stock declining 15% in the last year.
All else being equal, a share price drop should make a stock more attractive to potential investors. While the market sentiment towards a stock is very changeable, in the long run, the share price will tend to move in the same direction as earnings per share. So, on certain occasions, long term focussed investors try to take advantage of pessimistic expectations to buy shares at a better price. Perhaps the simplest way to get a read on investors' expectations of a business is to look at its Price to Earnings Ratio (PE Ratio). Investors have optimistic expectations of companies with higher P/E ratios, compared to companies with lower P/E ratios.
Check out our latest analysis for Manhattan Associates
How Does Manhattan Associates's P/E Ratio Compare To Its Peers?
Manhattan Associates's P/E is 35.05. The image below shows that Manhattan Associates has a P/E ratio that is roughly in line with the software industry average (33.7).
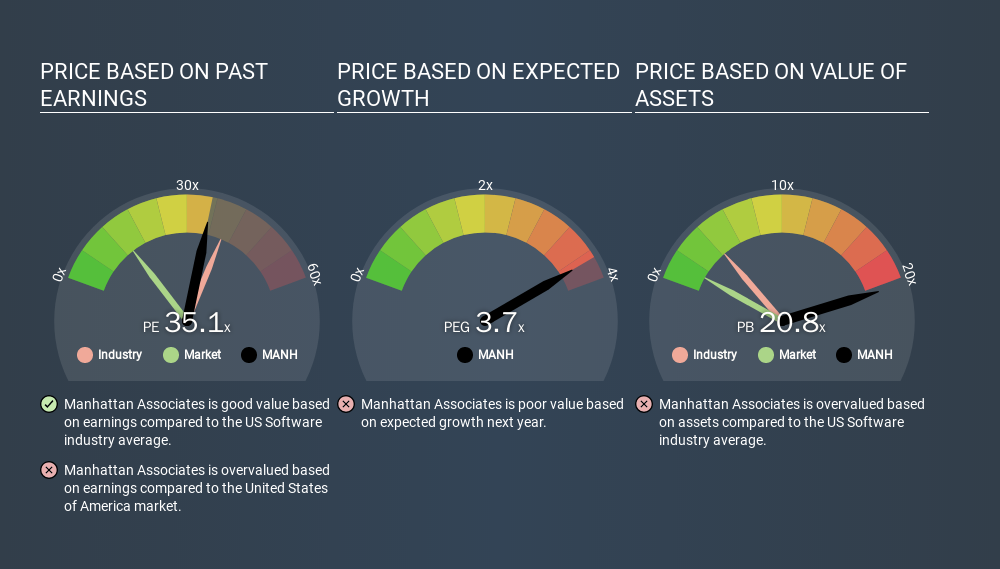
Manhattan Associates's P/E tells us that market participants think its prospects are roughly in line with its industry. So if Manhattan Associates actually outperforms its peers going forward, that should be a positive for the share price. I would further inform my view by checking insider buying and selling., among other things.
How Growth Rates Impact P/E Ratios
If earnings fall then in the future the 'E' will be lower. Therefore, even if you pay a low multiple of earnings now, that multiple will become higher in the future. A higher P/E should indicate the stock is expensive relative to others -- and that may encourage shareholders to sell.
Manhattan Associates shrunk earnings per share by 16% over the last year. But EPS is up 4.0% over the last 5 years. And EPS is down 8.4% a year, over the last 3 years. This might lead to low expectations.
Don't Forget: The P/E Does Not Account For Debt or Bank Deposits
Don't forget that the P/E ratio considers market capitalization. In other words, it does not consider any debt or cash that the company may have on the balance sheet. The exact same company would hypothetically deserve a higher P/E ratio if it had a strong balance sheet, than if it had a weak one with lots of debt, because a cashed up company can spend on growth.
Spending on growth might be good or bad a few years later, but the point is that the P/E ratio does not account for the option (or lack thereof).
Manhattan Associates's Balance Sheet
The extra options and safety that comes with Manhattan Associates's US$111m net cash position means that it deserves a higher P/E than it would if it had a lot of net debt.
The Verdict On Manhattan Associates's P/E Ratio
Manhattan Associates's P/E is 35.1 which is above average (12.7) in its market. The recent drop in earnings per share would make some investors cautious, but the net cash position means the company has time to improve: and the high P/E suggests the market thinks it will. What can be absolutely certain is that the market has become significantly less optimistic about Manhattan Associates over the last month, with the P/E ratio falling from 60.2 back then to 35.1 today. For those who don't like to trade against momentum, that could be a warning sign, but a contrarian investor might want to take a closer look.
When the market is wrong about a stock, it gives savvy investors an opportunity. As value investor Benjamin Graham famously said, 'In the short run, the market is a voting machine but in the long run, it is a weighing machine. So this free report on the analyst consensus forecasts could help you make a master move on this stock.
Of course, you might find a fantastic investment by looking at a few good candidates. So take a peek at this free list of companies with modest (or no) debt, trading on a P/E below 20.
If you spot an error that warrants correction, please contact the editor at editorial-team@simplywallst.com. This article by Simply Wall St is general in nature. It does not constitute a recommendation to buy or sell any stock, and does not take account of your objectives, or your financial situation. Simply Wall St has no position in the stocks mentioned.
We aim to bring you long-term focused research analysis driven by fundamental data. Note that our analysis may not factor in the latest price-sensitive company announcements or qualitative material. Thank you for reading.
About NasdaqGS:MANH
Manhattan Associates
Develops, sells, deploys, services, and maintains software solutions to manage supply chains, inventory, and omni-channel operations.
Flawless balance sheet with acceptable track record.
Similar Companies
Market Insights

Advertisement
Community Narratives
Finding The True Value Of A Logistics Powerhouse
Fair Value US$95.21|8.4% undervalued
NV
Community Contributor
Paradigm Biopharmaceuticals Will Lead Osteoarthritis Treatment with Zilosul's FDA Success
Fair Value AU$5.50|92.1% undervalued
AM
Community Contributor
Barrick Mining (ABX:CA): A Gold Hedge against a U.S. Shutdown
Fair Value CA$60.00|24.2% undervalued
GM
Community Contributor