- United States
- /
- Interactive Media and Services
- /
- NasdaqGS:ZD
Does J2 Global (NASDAQ:JCOM) Have A Healthy Balance Sheet?


Legendary fund manager Li Lu (who Charlie Munger backed) once said, 'The biggest investment risk is not the volatility of prices, but whether you will suffer a permanent loss of capital.' It's only natural to consider a company's balance sheet when you examine how risky it is, since debt is often involved when a business collapses. We can see that J2 Global, Inc. (NASDAQ:JCOM) does use debt in its business. But should shareholders be worried about its use of debt?
Why Does Debt Bring Risk?
Debt is a tool to help businesses grow, but if a business is incapable of paying off its lenders, then it exists at their mercy. Ultimately, if the company can't fulfill its legal obligations to repay debt, shareholders could walk away with nothing. However, a more frequent (but still costly) occurrence is where a company must issue shares at bargain-basement prices, permanently diluting shareholders, just to shore up its balance sheet. Of course, plenty of companies use debt to fund growth, without any negative consequences. The first thing to do when considering how much debt a business uses is to look at its cash and debt together.
Check out our latest analysis for J2 Global
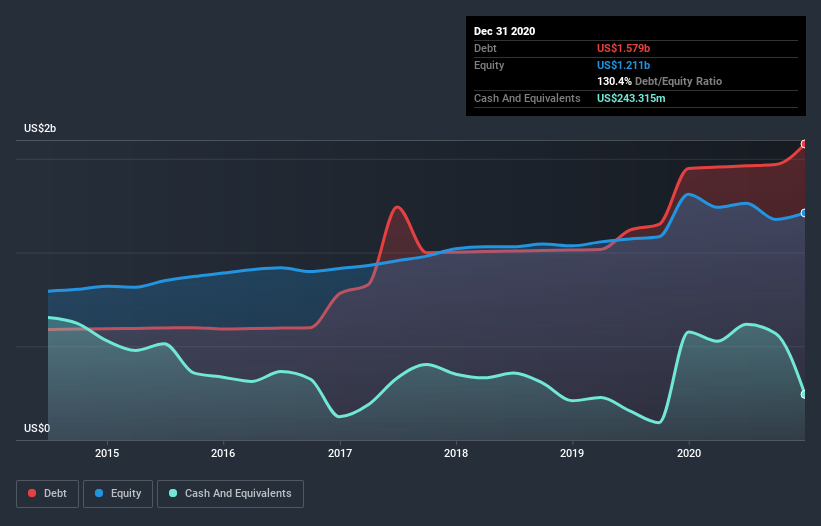
What Is J2 Global's Net Debt?
As you can see below, at the end of December 2020, J2 Global had US$1.58b of debt, up from US$1.45b a year ago. Click the image for more detail. However, it does have US$243.3m in cash offsetting this, leading to net debt of about US$1.34b.
A Look At J2 Global's Liabilities
The latest balance sheet data shows that J2 Global had liabilities of US$882.6m due within a year, and liabilities of US$1.57b falling due after that. Offsetting this, it had US$243.3m in cash and US$325.6m in receivables that were due within 12 months. So its liabilities outweigh the sum of its cash and (near-term) receivables by US$1.89b.
This deficit isn't so bad because J2 Global is worth US$5.56b, and thus could probably raise enough capital to shore up its balance sheet, if the need arose. But we definitely want to keep our eyes open to indications that its debt is bringing too much risk.
We use two main ratios to inform us about debt levels relative to earnings. The first is net debt divided by earnings before interest, tax, depreciation, and amortization (EBITDA), while the second is how many times its earnings before interest and tax (EBIT) covers its interest expense (or its interest cover, for short). This way, we consider both the absolute quantum of the debt, as well as the interest rates paid on it.
J2 Global's net debt is sitting at a very reasonable 2.3 times its EBITDA, while its EBIT covered its interest expense just 2.7 times last year. While that doesn't worry us too much, it does suggest the interest payments are somewhat of a burden. Also relevant is that J2 Global has grown its EBIT by a very respectable 24% in the last year, thus enhancing its ability to pay down debt. There's no doubt that we learn most about debt from the balance sheet. But it is future earnings, more than anything, that will determine J2 Global's ability to maintain a healthy balance sheet going forward. So if you're focused on the future you can check out this free report showing analyst profit forecasts.
Finally, a company can only pay off debt with cold hard cash, not accounting profits. So it's worth checking how much of that EBIT is backed by free cash flow. Over the last three years, J2 Global actually produced more free cash flow than EBIT. That sort of strong cash generation warms our hearts like a puppy in a bumblebee suit.
Our View
J2 Global's conversion of EBIT to free cash flow suggests it can handle its debt as easily as Cristiano Ronaldo could score a goal against an under 14's goalkeeper. But the stark truth is that we are concerned by its interest cover. Looking at all the aforementioned factors together, it strikes us that J2 Global can handle its debt fairly comfortably. Of course, while this leverage can enhance returns on equity, it does bring more risk, so it's worth keeping an eye on this one. The balance sheet is clearly the area to focus on when you are analysing debt. But ultimately, every company can contain risks that exist outside of the balance sheet. To that end, you should learn about the 2 warning signs we've spotted with J2 Global (including 1 which makes us a bit uncomfortable) .
If, after all that, you're more interested in a fast growing company with a rock-solid balance sheet, then check out our list of net cash growth stocks without delay.
When trading J2 Global or any other investment, use the platform considered by many to be the Professional's Gateway to the Worlds Market, Interactive Brokers. You get the lowest-cost* trading on stocks, options, futures, forex, bonds and funds worldwide from a single integrated account. Promoted
Valuation is complex, but we're here to simplify it.
Discover if Ziff Davis might be undervalued or overvalued with our detailed analysis, featuring fair value estimates, potential risks, dividends, insider trades, and its financial condition.
Access Free AnalysisThis article by Simply Wall St is general in nature. It does not constitute a recommendation to buy or sell any stock, and does not take account of your objectives, or your financial situation. We aim to bring you long-term focused analysis driven by fundamental data. Note that our analysis may not factor in the latest price-sensitive company announcements or qualitative material. Simply Wall St has no position in any stocks mentioned.
*Interactive Brokers Rated Lowest Cost Broker by StockBrokers.com Annual Online Review 2020
Have feedback on this article? Concerned about the content? Get in touch with us directly. Alternatively, email editorial-team (at) simplywallst.com.
About NasdaqGS:ZD
Ziff Davis
Operates as a digital media and internet company in the United States and internationally.
Flawless balance sheet and fair value.
Similar Companies
Market Insights

Community Narratives

