Advertisement
- United States
- /
- Software
- /
- NasdaqGS:GTLB
GitLab Full Year 2025 Earnings: EPS Beats Expectations
GitLab (NASDAQ:GTLB) Full Year 2025 Results
Key Financial Results
- Revenue: US$759.2m (up 31% from FY 2024).
- Net loss: US$2.43m (loss narrowed by 99% from FY 2024).
- US$0.015 loss per share (improved from US$2.75 loss in FY 2024).
All figures shown in the chart above are for the trailing 12 month (TTM) period
GitLab EPS Beats Expectations
Revenue was in line with analyst estimates. Earnings per share (EPS) surpassed analyst estimates by 87%.
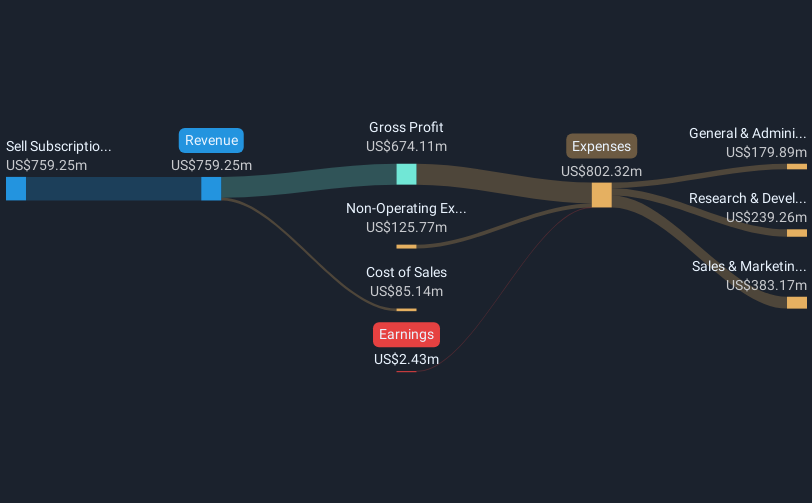
In the last 12 months, the only revenue segment was Sell Subscriptions on Both Self-Managed and Saas Models contributing US$759.2m. The largest operating expense was Sales & Marketing costs, amounting to US$383.2m (48% of total expenses). Over the last 12 months, the company's earnings were enhanced by non-operating gains of US$125.8m. Explore how GTLB's revenue and expenses shape its earnings.
Looking ahead, revenue is forecast to grow 17% p.a. on average during the next 3 years, compared to a 12% growth forecast for the Software industry in the US.
Performance of the American Software industry.
The company's shares are up 3.3% from a week ago.
Risk Analysis
Be aware that GitLab is showing 3 warning signs in our investment analysis and 1 of those shouldn't be ignored...
New: Manage All Your Stock Portfolios in One Place
We've created the ultimate portfolio companion for stock investors, and it's free.
• Connect an unlimited number of Portfolios and see your total in one currency
• Be alerted to new Warning Signs or Risks via email or mobile
• Track the Fair Value of your stocks
Have feedback on this article? Concerned about the content? Get in touch with us directly. Alternatively, email editorial-team (at) simplywallst.com.
This article by Simply Wall St is general in nature. We provide commentary based on historical data and analyst forecasts only using an unbiased methodology and our articles are not intended to be financial advice. It does not constitute a recommendation to buy or sell any stock, and does not take account of your objectives, or your financial situation. We aim to bring you long-term focused analysis driven by fundamental data. Note that our analysis may not factor in the latest price-sensitive company announcements or qualitative material. Simply Wall St has no position in any stocks mentioned.
About NasdaqGS:GTLB
GitLab
Develops software for the software development lifecycle in the United States, Europe, and the Asia Pacific.
Flawless balance sheet and good value.
Similar Companies
Market Insights


Advertisement
Weekly Picks
ST


stuart_roberts on Unicycive Therapeutics ·
Looking to be second time lucky with a game-changing new product
Fair Value:US$21.5360.5% undervalued
135 followersusers have followed this narrative
0 commentsusers have commented on this narrative
19 likesusers have liked this narrative
DE


Degen_GCR on Everpure ·
Second order memory play likely to double in a year
Fair Value:US$18053.1% undervalued
18 followersusers have followed this narrative
1 commentusers have commented on this narrative
12 likesusers have liked this narrative
DO


Double_Bubbler on Intuitive Machines ·
Intuitive Machines: To The Moon and Beyond!
Fair Value:US$42.315.7% undervalued
9 followersusers have followed this narrative
0 commentsusers have commented on this narrative
5 likesusers have liked this narrative
YI

yiannisz on AppLovin ·
AppLovin’s AI Engine Is Printing Profit
Fair Value:US$989.2454.2% undervalued
30 followersusers have followed this narrative
2 commentsusers have commented on this narrative
1 likeusers have liked this narrative
Recently Updated Narratives
KA

kapirey on Unicycive Therapeutics ·
Unicycive Therapeutics is a late-stage clinical biotech transitioning toward commercialization
Fair Value:US$9.177.2% undervalued
1 followerusers have followed this narrative
0 commentsusers have commented on this narrative
0 likesusers have liked this narrative
KA

kapirey on Guming Holdings ·
A scaled, high-growth, franchise-driven beverage leader with strong penetration in China
Fair Value:HK$47.5650.7% undervalued
1 followerusers have followed this narrative
0 commentsusers have commented on this narrative
0 likesusers have liked this narrative
HE


HedgeY on IonQ ·
The Best-Funded Quantum Platform and Still a Stock Priced for Perfection
Fair Value:US$4815.1% overvalued
1 followerusers have followed this narrative
0 commentsusers have commented on this narrative
0 likesusers have liked this narrative
Popular Narratives
GO

GoldenSands on QuantumScape ·
QuantumScape: A Mispriced Deep‑Tech Inflection Point With Multi‑Billion‑Dollar Optionality
Fair Value:US$8589.8% undervalued
108 followersusers have followed this narrative
2 commentsusers have commented on this narrative
31 likesusers have liked this narrative
KI

Kingman1152 on NVIDIA ·
NVIDIA will see a profit margin surge of 55% in the next 5 years
Fair Value:US$305.226.0% undervalued
70 followersusers have followed this narrative
2 commentsusers have commented on this narrative
24 likesusers have liked this narrative
TR


tripledub on Meta Platforms ·
The $135 Billion Bet That Should Make Every Shareholder Nervous
Fair Value:US$74016.7% undervalued
36 followersusers have followed this narrative
3 commentsusers have commented on this narrative
33 likesusers have liked this narrative
