
Advertisement
- United States
- /
- Software
- /
- OTCPK:EBIX.Q
Here's Why Ebix (NASDAQ:EBIX) Has A Meaningful Debt Burden
The external fund manager backed by Berkshire Hathaway's Charlie Munger, Li Lu, makes no bones about it when he says 'The biggest investment risk is not the volatility of prices, but whether you will suffer a permanent loss of capital.' It's only natural to consider a company's balance sheet when you examine how risky it is, since debt is often involved when a business collapses. We can see that Ebix, Inc. (NASDAQ:EBIX) does use debt in its business. But the more important question is: how much risk is that debt creating?
What Risk Does Debt Bring?
Debt assists a business until the business has trouble paying it off, either with new capital or with free cash flow. Ultimately, if the company can't fulfill its legal obligations to repay debt, shareholders could walk away with nothing. However, a more frequent (but still costly) occurrence is where a company must issue shares at bargain-basement prices, permanently diluting shareholders, just to shore up its balance sheet. Of course, debt can be an important tool in businesses, particularly capital heavy businesses. When we examine debt levels, we first consider both cash and debt levels, together.
Check out our latest analysis for Ebix
What Is Ebix's Net Debt?
As you can see below, Ebix had US$617.4m of debt at March 2023, down from US$647.1m a year prior. However, it does have US$94.7m in cash offsetting this, leading to net debt of about US$522.8m.
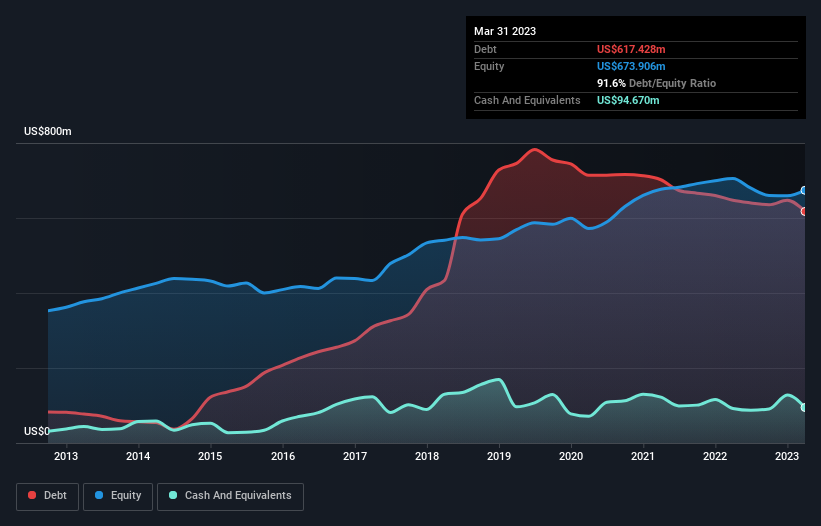
A Look At Ebix's Liabilities
Zooming in on the latest balance sheet data, we can see that Ebix had liabilities of US$823.7m due within 12 months and liabilities of US$44.0m due beyond that. Offsetting this, it had US$94.7m in cash and US$167.3m in receivables that were due within 12 months. So it has liabilities totalling US$605.6m more than its cash and near-term receivables, combined.
This deficit is considerable relative to its market capitalization of US$956.7m, so it does suggest shareholders should keep an eye on Ebix's use of debt. Should its lenders demand that it shore up the balance sheet, shareholders would likely face severe dilution.
We measure a company's debt load relative to its earnings power by looking at its net debt divided by its earnings before interest, tax, depreciation, and amortization (EBITDA) and by calculating how easily its earnings before interest and tax (EBIT) cover its interest expense (interest cover). This way, we consider both the absolute quantum of the debt, as well as the interest rates paid on it.
While we wouldn't worry about Ebix's net debt to EBITDA ratio of 3.7, we think its super-low interest cover of 1.8 times is a sign of high leverage. So shareholders should probably be aware that interest expenses appear to have really impacted the business lately. The good news is that Ebix improved its EBIT by 2.4% over the last twelve months, thus gradually reducing its debt levels relative to its earnings. The balance sheet is clearly the area to focus on when you are analysing debt. But ultimately the future profitability of the business will decide if Ebix can strengthen its balance sheet over time. So if you want to see what the professionals think, you might find this free report on analyst profit forecasts to be interesting.
Finally, a company can only pay off debt with cold hard cash, not accounting profits. So it's worth checking how much of that EBIT is backed by free cash flow. In the last three years, Ebix's free cash flow amounted to 49% of its EBIT, less than we'd expect. That's not great, when it comes to paying down debt.
Our View
Ebix's interest cover was a real negative on this analysis, although the other factors we considered cast it in a significantly better light. For example, its conversion of EBIT to free cash flow is relatively strong. When we consider all the factors discussed, it seems to us that Ebix is taking some risks with its use of debt. So while that leverage does boost returns on equity, we wouldn't really want to see it increase from here. The balance sheet is clearly the area to focus on when you are analysing debt. However, not all investment risk resides within the balance sheet - far from it. Case in point: We've spotted 1 warning sign for Ebix you should be aware of.
At the end of the day, it's often better to focus on companies that are free from net debt. You can access our special list of such companies (all with a track record of profit growth). It's free.
Valuation is complex, but we're here to simplify it.
Discover if Ebix might be undervalued or overvalued with our detailed analysis, featuring fair value estimates, potential risks, dividends, insider trades, and its financial condition.
Access Free AnalysisHave feedback on this article? Concerned about the content? Get in touch with us directly. Alternatively, email editorial-team (at) simplywallst.com.
This article by Simply Wall St is general in nature. We provide commentary based on historical data and analyst forecasts only using an unbiased methodology and our articles are not intended to be financial advice. It does not constitute a recommendation to buy or sell any stock, and does not take account of your objectives, or your financial situation. We aim to bring you long-term focused analysis driven by fundamental data. Note that our analysis may not factor in the latest price-sensitive company announcements or qualitative material. Simply Wall St has no position in any stocks mentioned.
 mitchell_lawler
The Foxhole
Micron (MU) is booming, and it still doesn't look ‘expensive’ based on next year's earnings. So why does our own valuation say it could be worth 40% less?
2413
zoe_vi5fn
A low price to earnings ratio at the top of the cycle is a warning rather than a bargain, and a terrifyingly high one at the bottom is often the entry point
darius_xnnrd
Memory used to have a dozen participants racing each other into oversupply, and now it has three. High bandwidth memory is qualified into customer designs years ahead, sold under long-term agreements, and is far harder to switch away from than commodity DRAM.
About OTCPK:EBIX.Q
Ebix
Provides on-demand infrastructure software exchanges and e-commerce services to the insurance, financial, travel, cash remittance, and healthcare industries in the United States and internationally.
Medium-low and good value.
Similar Companies
Market Insights

Advertisement
Weekly Picks
RI


Rick_Orford on Starfighters Space ·
The 1960s Fighter Jet That Could Crack Open a $20 Billion Satellite Market
Fair Value:US$515.2% undervalued
34 followersusers have followed this narrative
1 commentusers have commented on this narrative
6 likesusers have liked this narrative
FU


FundamentalFlow on Vertiv Holdings Co ·
The Short and Long Term Compounder of Liquid Cooling industry.
Fair Value:US$45034.7% undervalued
62 followersusers have followed this narrative
0 commentsusers have commented on this narrative
12 likesusers have liked this narrative
JO


John_Eric on SPX Technologies ·
I Fell in Love With a Data-Center Cooling Stock. Then I Opened the Filings.
Fair Value:US$2037.1% overvalued
27 followersusers have followed this narrative
2 commentsusers have commented on this narrative
11 likesusers have liked this narrative
TR


tripledub on GQG Partners ·
The Cheap Genius Problem
Fair Value:AU$3.2155.0% undervalued
36 followersusers have followed this narrative
0 commentsusers have commented on this narrative
24 likesusers have liked this narrative
Recently Updated Narratives
SE


Sertan1978 on International Business Machines ·
Why I See IBM as a Long-Term Enterprise AI and Hybrid Cloud Play
Fair Value:US$166.7340.5% overvalued
1 followerusers have followed this narrative
0 commentsusers have commented on this narrative
0 likesusers have liked this narrative
AN


andrei9868 on Vistra ·
Vistra Energy ($VST): The Flexible Power Platform Capturing AI Load Growth
Fair Value:US$22534.2% undervalued
1 followerusers have followed this narrative
0 commentsusers have commented on this narrative
0 likesusers have liked this narrative
AN

andrei9868 on Constellation Energy ·
Constellation Energy ($CEG): The Nuclear Scarcity Play Powering the AI Demand Boom
Fair Value:US$35019.3% undervalued
1 followerusers have followed this narrative
0 commentsusers have commented on this narrative
0 likesusers have liked this narrative
Popular Narratives
OS


oscargarcia on NVIDIA ·
The company that went from selling GPUs to gamers to becoming the AI arms dealer of the 21st century.
Fair Value:US$28019.6% undervalued
314 followersusers have followed this narrative
9 commentsusers have commented on this narrative
16 likesusers have liked this narrative
CU

CubanEros on Microsoft ·
A wonderful business at reasonable price.
Fair Value:US$419.9118.0% overvalued
172 followersusers have followed this narrative
0 commentsusers have commented on this narrative
8 likesusers have liked this narrative
KI

KiwiInvest on Amazon.com ·
Amazon's high growth, high tech segments propel its profits, while traditional segments plod along
Fair Value:US$475.0944.7% undervalued
192 followersusers have followed this narrative
1 commentusers have commented on this narrative
8 likesusers have liked this narrative
Trending Discussion
JA
james_rxfd8 on Starfighters Space ·
How is this different to Virgin Orbit, which didn’t seem to work out, with a very similar plan?
3
|2
GE

george_b177x on Bloom Energy ·
Brilliant analysis. Great company with proven product and service!
1
|1