Advertisement
- United States
- /
- Software
- /
- NasdaqCM:CLSK
Is CleanSpark Stock’s 22% Surge Justified After Recent Bitcoin Mining Expansion?

Simply Wall St
Reviewed by Bailey Pemberton
- Ever wondered whether CleanSpark stock is truly a bargain or just riding a wave? You're not alone. This is where things get interesting for investors ready to dig into what really drives value.
- Over just the past month, CleanSpark shot up 22.0%, capping a wild ride year-to-date with gains of 88.4% and an eye-popping 487.5% surge over three years. There have been some sharp pullbacks as well, including a recent 8.1% dip in just one week.
- Recent headlines have spotlighted CleanSpark's aggressive expansion in the Bitcoin mining space and their continued build-out of renewable energy projects. These developments are fueling both optimism and debate about the company's long-term payoff potential. This helps set the stage for why price moves have been so dramatic.
- When measured across six key valuation checks, CleanSpark scores just 2 out of 6 for undervaluation. We'll break down what goes into those checks and why, at the end, there's an even more insightful way to gauge what CleanSpark is really worth.
CleanSpark scores just 2/6 on our valuation checks. See what other red flags we found in the full valuation breakdown.
Approach 1: CleanSpark Discounted Cash Flow (DCF) Analysis
A Discounted Cash Flow (DCF) model works by taking projections of a company's future cash flows and discounting them back to the present to estimate what the business is worth today. This method tries to capture the company's long-term profitability and reveal whether the stock price reflects fair value based on these projections.
For CleanSpark, the DCF model uses a 2 Stage Free Cash Flow to Equity approach. At the moment, CleanSpark's last twelve months of free cash flow stands at -$565 million, meaning the company is not yet generating positive cash flow. Analysts expect this to turn around, projecting free cash flow of $244 million in 2026 and $165 million in 2027. Beyond that, Simply Wall St extrapolates a steady decrease, with ten-year projections seeing FCF drop to roughly $85.3 million by 2035. All projections are provided in US dollars.
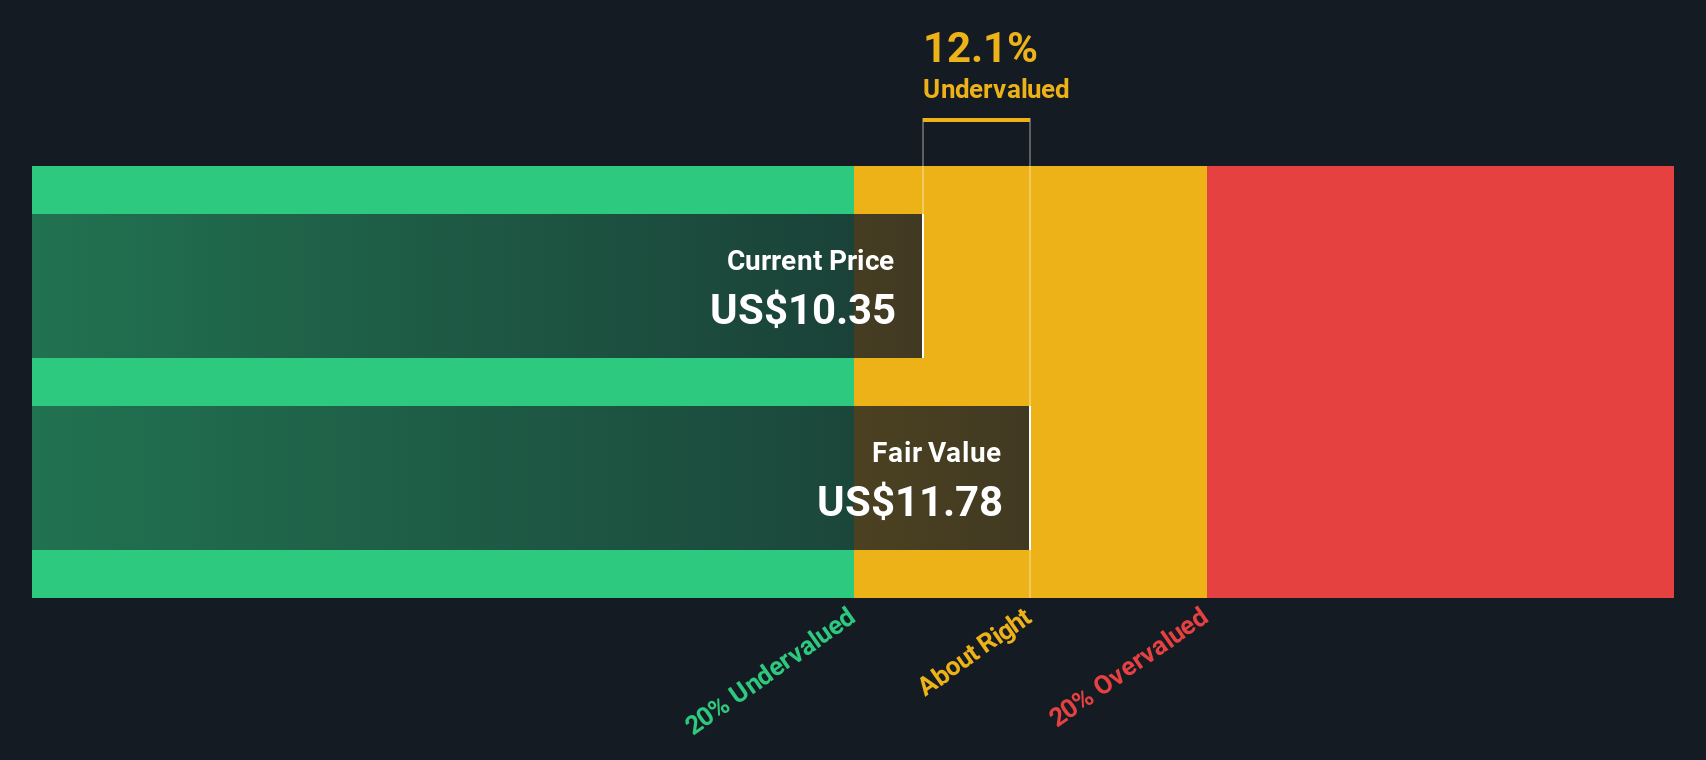
When these cash flows are discounted back to today's value, the estimated intrinsic value for CleanSpark is $5.20 per share. With the current share price trading significantly higher, the DCF model suggests CleanSpark stock is around 242.4% overvalued based on these assumptions.
Result: OVERVALUED
Our Discounted Cash Flow (DCF) analysis suggests CleanSpark may be overvalued by 242.4%. Discover 831 undervalued stocks or create your own screener to find better value opportunities.
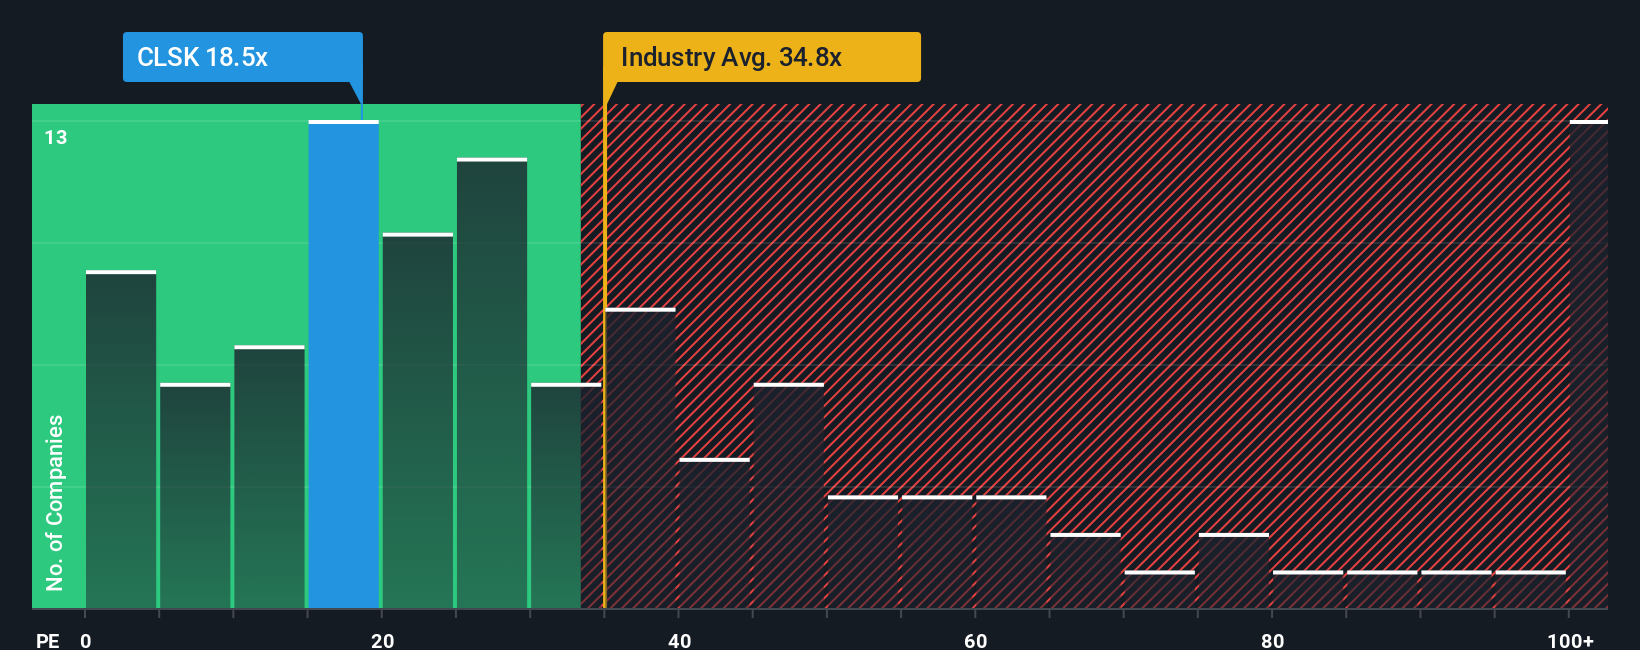
Approach 2: CleanSpark Price vs Earnings
For profitable companies, the Price-to-Earnings (PE) ratio is a go-to valuation metric because it directly connects a company's stock price to its earnings power. Investors often look to PE as a quick check on how much they are paying for each dollar of profit. The “right” PE ratio, however, depends on a company’s growth prospects and risk profile. Higher expected growth can justify a higher PE, while elevated risks usually call for a discount.
CleanSpark is currently trading at a PE ratio of 17.1x. To put this in context, the peer average sits at 13.9x, while the broader Software industry commands an average of 34.7x. Therefore, CleanSpark is priced higher than its peers but lower than the industry overall.
This is where Simply Wall St’s Fair Ratio comes in. The Fair Ratio (in this case, 27.5x) is tailored to CleanSpark, taking into account its specific earnings growth, profit margins, market cap, industry, and risk factors. Rather than using simple peer or sector comparisons, the Fair Ratio aims to determine what the company should be worth based on its own characteristics, making it a more insightful yardstick.
Comparing CleanSpark’s actual PE ratio of 17.1x to its Fair Ratio of 27.5x suggests the stock is currently trading at a discount to its fair value.
Result: UNDERVALUED
PE ratios tell one story, but what if the real opportunity lies elsewhere? Discover 1410 companies where insiders are betting big on explosive growth.
Upgrade Your Decision Making: Choose your CleanSpark Narrative
Earlier, we mentioned that there's an even better way to understand valuation, so let's introduce you to Narratives. In investing, a Narrative is simply your story and perspective about a company: how you see its future and what you believe its revenue, profits, and market position could look like years from now.
Narratives link this story directly to a financial forecast, turning your perspective about CleanSpark into concrete numbers that drive a fair value estimate. This makes Narratives a much more powerful and dynamic tool than just looking at ratios or static price targets, because you’re combining what you know (or believe) about the business with what the numbers say.
The best part is that Narratives are available to everyone on the Simply Wall St platform, right in the Community page where millions of investors actively update their views. Narratives update automatically whenever new information, such as earnings or news, comes in, so your insights stay current and relevant.
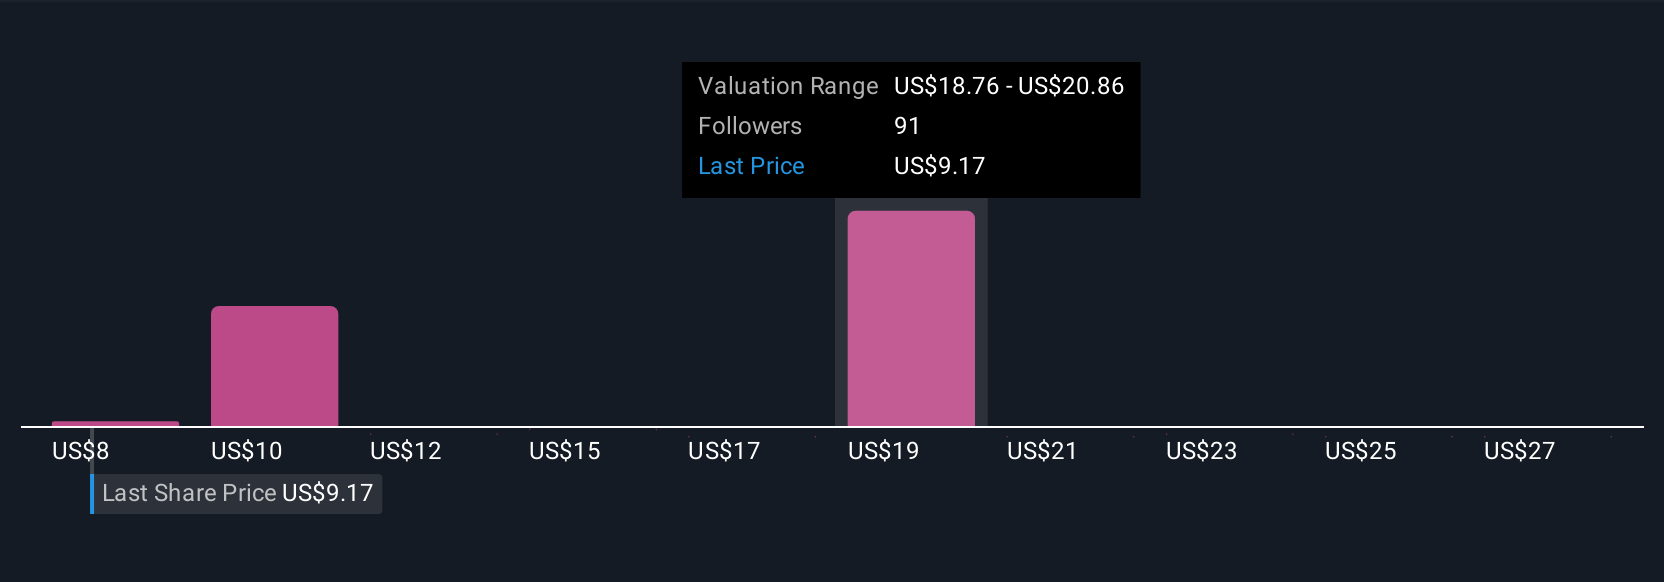
Comparing your Narrative’s fair value to the current price lets you confidently decide when to buy or sell. For example, using CleanSpark, one investor might see an aggressive expansion and set a fair value near $25, while another might worry about Bitcoin risks and set it closer to $15. Both approaches are valid, and the tool lets you see how reality stacks up against your outlook.
Do you think there's more to the story for CleanSpark? Head over to our Community to see what others are saying!
This article by Simply Wall St is general in nature. We provide commentary based on historical data and analyst forecasts only using an unbiased methodology and our articles are not intended to be financial advice. It does not constitute a recommendation to buy or sell any stock, and does not take account of your objectives, or your financial situation. We aim to bring you long-term focused analysis driven by fundamental data. Note that our analysis may not factor in the latest price-sensitive company announcements or qualitative material. Simply Wall St has no position in any stocks mentioned.
New: AI Stock Screener & Alerts
Our new AI Stock Screener scans the market every day to uncover opportunities.
• Dividend Powerhouses (3%+ Yield)
• Undervalued Small Caps with Insider Buying
• High growth Tech and AI Companies
Or build your own from over 50 metrics.
Have feedback on this article? Concerned about the content? Get in touch with us directly. Alternatively, email editorial-team@simplywallst.com
About NasdaqCM:CLSK
Adequate balance sheet with moderate growth potential.
Similar Companies
Market Insights

Advertisement
Community Narratives
The company that turned a verb into a global necessity and basically runs the modern internet, digital ads, smartphones, maps, and AI.
Fair Value US$300.00|6.3% undervalued
OS
Community Contributor
Flowers Foods Pays A Fair Price For Health
Fair Value US$16.12|26.0% undervalued
NV
Community Contributor
TMX Group will thrive with 33.3% profit margin and enduring market moat
Fair Value CA$49.90|3.7% overvalued
LI
Community Contributor