- United States
- /
- IT
- /
- NasdaqGS:AKAM
Are Investors Undervaluing Akamai Technologies, Inc. (NASDAQ:AKAM) By 26%?


Key Insights
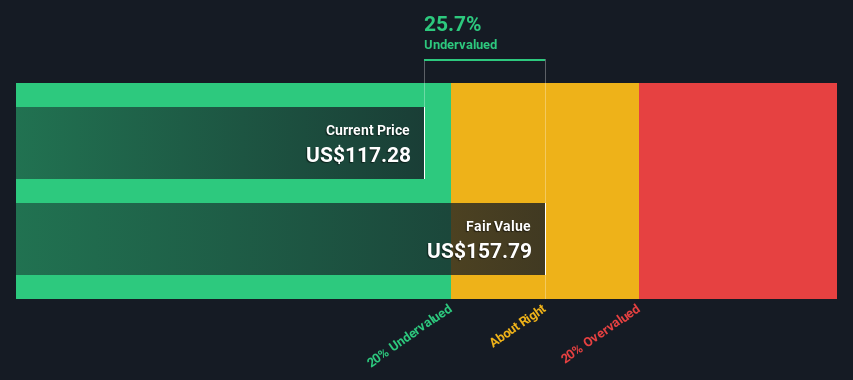
- Akamai Technologies' estimated fair value is US$158 based on 2 Stage Free Cash Flow to Equity
- Akamai Technologies' US$117 share price signals that it might be 26% undervalued
- Our fair value estimate is 33% higher than Akamai Technologies' analyst price target of US$119
How far off is Akamai Technologies, Inc. (NASDAQ:AKAM) from its intrinsic value? Using the most recent financial data, we'll take a look at whether the stock is fairly priced by taking the forecast future cash flows of the company and discounting them back to today's value. We will take advantage of the Discounted Cash Flow (DCF) model for this purpose. Believe it or not, it's not too difficult to follow, as you'll see from our example!
We generally believe that a company's value is the present value of all of the cash it will generate in the future. However, a DCF is just one valuation metric among many, and it is not without flaws. If you still have some burning questions about this type of valuation, take a look at the Simply Wall St analysis model.
Check out our latest analysis for Akamai Technologies
Crunching The Numbers
We use what is known as a 2-stage model, which simply means we have two different periods of growth rates for the company's cash flows. Generally the first stage is higher growth, and the second stage is a lower growth phase. In the first stage we need to estimate the cash flows to the business over the next ten years. Where possible we use analyst estimates, but when these aren't available we extrapolate the previous free cash flow (FCF) from the last estimate or reported value. We assume companies with shrinking free cash flow will slow their rate of shrinkage, and that companies with growing free cash flow will see their growth rate slow, over this period. We do this to reflect that growth tends to slow more in the early years than it does in later years.
Generally we assume that a dollar today is more valuable than a dollar in the future, so we discount the value of these future cash flows to their estimated value in today's dollars:
10-year free cash flow (FCF) forecast
| 2024 | 2025 | 2026 | 2027 | 2028 | 2029 | 2030 | 2031 | 2032 | 2033 | |
| Levered FCF ($, Millions) | US$839.2m | US$1.03b | US$1.29b | US$1.39b | US$1.55b | US$1.68b | US$1.78b | US$1.86b | US$1.94b | US$2.01b |
| Growth Rate Estimate Source | Analyst x12 | Analyst x6 | Analyst x1 | Analyst x1 | Analyst x1 | Est @ 7.73% | Est @ 6.08% | Est @ 4.92% | Est @ 4.11% | Est @ 3.54% |
| Present Value ($, Millions) Discounted @ 8.5% | US$773 | US$871 | US$1.0k | US$1.0k | US$1.0k | US$1.0k | US$1.0k | US$967 | US$928 | US$885 |
("Est" = FCF growth rate estimated by Simply Wall St)
Present Value of 10-year Cash Flow (PVCF) = US$9.5b
After calculating the present value of future cash flows in the initial 10-year period, we need to calculate the Terminal Value, which accounts for all future cash flows beyond the first stage. The Gordon Growth formula is used to calculate Terminal Value at a future annual growth rate equal to the 5-year average of the 10-year government bond yield of 2.2%. We discount the terminal cash flows to today's value at a cost of equity of 8.5%.
Terminal Value (TV)= FCF2033 × (1 + g) ÷ (r – g) = US$2.0b× (1 + 2.2%) ÷ (8.5%– 2.2%) = US$32b
Present Value of Terminal Value (PVTV)= TV / (1 + r)10= US$32b÷ ( 1 + 8.5%)10= US$14b
The total value, or equity value, is then the sum of the present value of the future cash flows, which in this case is US$24b. In the final step we divide the equity value by the number of shares outstanding. Relative to the current share price of US$117, the company appears a touch undervalued at a 26% discount to where the stock price trades currently. Remember though, that this is just an approximate valuation, and like any complex formula - garbage in, garbage out.
Important Assumptions
We would point out that the most important inputs to a discounted cash flow are the discount rate and of course the actual cash flows. Part of investing is coming up with your own evaluation of a company's future performance, so try the calculation yourself and check your own assumptions. The DCF also does not consider the possible cyclicality of an industry, or a company's future capital requirements, so it does not give a full picture of a company's potential performance. Given that we are looking at Akamai Technologies as potential shareholders, the cost of equity is used as the discount rate, rather than the cost of capital (or weighted average cost of capital, WACC) which accounts for debt. In this calculation we've used 8.5%, which is based on a levered beta of 1.265. Beta is a measure of a stock's volatility, compared to the market as a whole. We get our beta from the industry average beta of globally comparable companies, with an imposed limit between 0.8 and 2.0, which is a reasonable range for a stable business.
SWOT Analysis for Akamai Technologies
- Debt is well covered by earnings and cashflows.
- Earnings declined over the past year.
- Annual earnings are forecast to grow faster than the American market.
- Good value based on P/E ratio and estimated fair value.
- Annual revenue is forecast to grow slower than the American market.
Moving On:
Valuation is only one side of the coin in terms of building your investment thesis, and it ideally won't be the sole piece of analysis you scrutinize for a company. DCF models are not the be-all and end-all of investment valuation. Rather it should be seen as a guide to "what assumptions need to be true for this stock to be under/overvalued?" For example, changes in the company's cost of equity or the risk free rate can significantly impact the valuation. What is the reason for the share price sitting below the intrinsic value? For Akamai Technologies, there are three fundamental factors you should further research:
- Risks: Every company has them, and we've spotted 2 warning signs for Akamai Technologies you should know about.
- Management:Have insiders been ramping up their shares to take advantage of the market's sentiment for AKAM's future outlook? Check out our management and board analysis with insights on CEO compensation and governance factors.
- Other High Quality Alternatives: Do you like a good all-rounder? Explore our interactive list of high quality stocks to get an idea of what else is out there you may be missing!
PS. Simply Wall St updates its DCF calculation for every American stock every day, so if you want to find the intrinsic value of any other stock just search here.
New: Manage All Your Stock Portfolios in One Place
We've created the ultimate portfolio companion for stock investors, and it's free.
• Connect an unlimited number of Portfolios and see your total in one currency
• Be alerted to new Warning Signs or Risks via email or mobile
• Track the Fair Value of your stocks
Have feedback on this article? Concerned about the content? Get in touch with us directly. Alternatively, email editorial-team (at) simplywallst.com.
This article by Simply Wall St is general in nature. We provide commentary based on historical data and analyst forecasts only using an unbiased methodology and our articles are not intended to be financial advice. It does not constitute a recommendation to buy or sell any stock, and does not take account of your objectives, or your financial situation. We aim to bring you long-term focused analysis driven by fundamental data. Note that our analysis may not factor in the latest price-sensitive company announcements or qualitative material. Simply Wall St has no position in any stocks mentioned.
About NasdaqGS:AKAM
Akamai Technologies
Provides cloud computing, security, and content delivery services in the United States and internationally.
Undervalued with proven track record.

