- United States
- /
- Semiconductors
- /
- NasdaqGS:SLAB
Silicon Laboratories Inc.'s (NASDAQ:SLAB) Fundamentals Look Pretty Strong: Could The Market Be Wrong About The Stock?


Silicon Laboratories (NASDAQ:SLAB) has had a rough three months with its share price down 26%. But if you pay close attention, you might find that its key financial indicators look quite decent, which could mean that the stock could potentially rise in the long-term given how markets usually reward more resilient long-term fundamentals. Specifically, we decided to study Silicon Laboratories' ROE in this article.
ROE or return on equity is a useful tool to assess how effectively a company can generate returns on the investment it received from its shareholders. In other words, it is a profitability ratio which measures the rate of return on the capital provided by the company's shareholders.
Check out our latest analysis for Silicon Laboratories
How Is ROE Calculated?
Return on equity can be calculated by using the formula:
Return on Equity = Net Profit (from continuing operations) ÷ Shareholders' Equity
So, based on the above formula, the ROE for Silicon Laboratories is:
4.8% = US$61m ÷ US$1.3b (Based on the trailing twelve months to September 2023).
The 'return' refers to a company's earnings over the last year. One way to conceptualize this is that for each $1 of shareholders' capital it has, the company made $0.05 in profit.
What Is The Relationship Between ROE And Earnings Growth?
So far, we've learned that ROE is a measure of a company's profitability. We now need to evaluate how much profit the company reinvests or "retains" for future growth which then gives us an idea about the growth potential of the company. Assuming everything else remains unchanged, the higher the ROE and profit retention, the higher the growth rate of a company compared to companies that don't necessarily bear these characteristics.
Silicon Laboratories' Earnings Growth And 4.8% ROE
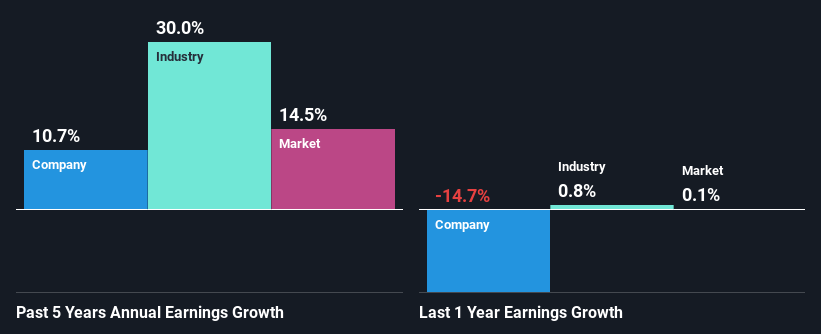
At first glance, Silicon Laboratories' ROE doesn't look very promising. A quick further study shows that the company's ROE doesn't compare favorably to the industry average of 15% either. Silicon Laboratories was still able to see a decent net income growth of 11% over the past five years. We reckon that there could be other factors at play here. Such as - high earnings retention or an efficient management in place.
As a next step, we compared Silicon Laboratories' net income growth with the industry and were disappointed to see that the company's growth is lower than the industry average growth of 30% in the same period.
The basis for attaching value to a company is, to a great extent, tied to its earnings growth. It’s important for an investor to know whether the market has priced in the company's expected earnings growth (or decline). Doing so will help them establish if the stock's future looks promising or ominous. Has the market priced in the future outlook for SLAB? You can find out in our latest intrinsic value infographic research report.
Is Silicon Laboratories Using Its Retained Earnings Effectively?
Silicon Laboratories doesn't pay any dividend, meaning that all of its profits are being reinvested in the business, which explains the fair bit of earnings growth the company has seen.
Conclusion
On the whole, we do feel that Silicon Laboratories has some positive attributes. Namely, its respectable earnings growth, which it achieved due to it retaining most of its profits. However, given the low ROE, investors may not be benefitting from all that reinvestment after all. With that said, on studying the latest analyst forecasts, we found that while the company has seen growth in its past earnings, analysts expect its future earnings to shrink. Are these analysts expectations based on the broad expectations for the industry, or on the company's fundamentals? Click here to be taken to our analyst's forecasts page for the company.
New: Manage All Your Stock Portfolios in One Place
We've created the ultimate portfolio companion for stock investors, and it's free.
• Connect an unlimited number of Portfolios and see your total in one currency
• Be alerted to new Warning Signs or Risks via email or mobile
• Track the Fair Value of your stocks
Have feedback on this article? Concerned about the content? Get in touch with us directly. Alternatively, email editorial-team (at) simplywallst.com.
This article by Simply Wall St is general in nature. We provide commentary based on historical data and analyst forecasts only using an unbiased methodology and our articles are not intended to be financial advice. It does not constitute a recommendation to buy or sell any stock, and does not take account of your objectives, or your financial situation. We aim to bring you long-term focused analysis driven by fundamental data. Note that our analysis may not factor in the latest price-sensitive company announcements or qualitative material. Simply Wall St has no position in any stocks mentioned.
About NasdaqGS:SLAB
Silicon Laboratories
A fabless semiconductor company, provides various analog-intensive mixed-signal solutions in the United States, China, Taiwan, and internationally.
High growth potential with excellent balance sheet.
Similar Companies
Market Insights

Community Narratives

