- United States
- /
- Semiconductors
- /
- NasdaqGS:QCOM
QUALCOMM Incorporated's (NASDAQ:QCOM) Fundamentals Look Pretty Strong: Could The Market Be Wrong About The Stock?

With its stock down 8.5% over the past month, it is easy to disregard QUALCOMM (NASDAQ:QCOM). However, a closer look at its sound financials might cause you to think again. Given that fundamentals usually drive long-term market outcomes, the company is worth looking at. Specifically, we decided to study QUALCOMM's ROE in this article.
Return on equity or ROE is a key measure used to assess how efficiently a company's management is utilizing the company's capital. In other words, it is a profitability ratio which measures the rate of return on the capital provided by the company's shareholders.
Check out our latest analysis for QUALCOMM
How Is ROE Calculated?
The formula for ROE is:
Return on Equity = Net Profit (from continuing operations) ÷ Shareholders' Equity
So, based on the above formula, the ROE for QUALCOMM is:
63% = US$12b ÷ US$19b (Based on the trailing twelve months to December 2022).
The 'return' is the amount earned after tax over the last twelve months. Another way to think of that is that for every $1 worth of equity, the company was able to earn $0.63 in profit.
What Is The Relationship Between ROE And Earnings Growth?
So far, we've learned that ROE is a measure of a company's profitability. Depending on how much of these profits the company reinvests or "retains", and how effectively it does so, we are then able to assess a company’s earnings growth potential. Assuming all else is equal, companies that have both a higher return on equity and higher profit retention are usually the ones that have a higher growth rate when compared to companies that don't have the same features.
A Side By Side comparison of QUALCOMM's Earnings Growth And 63% ROE
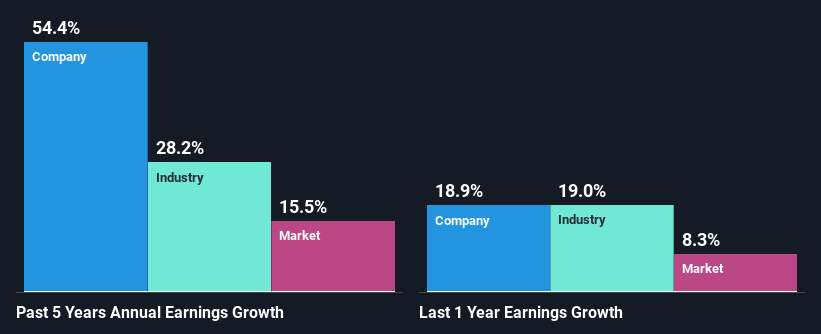
Firstly, we acknowledge that QUALCOMM has a significantly high ROE. Secondly, even when compared to the industry average of 19% the company's ROE is quite impressive. Under the circumstances, QUALCOMM's considerable five year net income growth of 54% was to be expected.
As a next step, we compared QUALCOMM's net income growth with the industry, and pleasingly, we found that the growth seen by the company is higher than the average industry growth of 28%.
Earnings growth is a huge factor in stock valuation. What investors need to determine next is if the expected earnings growth, or the lack of it, is already built into the share price. By doing so, they will have an idea if the stock is headed into clear blue waters or if swampy waters await. Has the market priced in the future outlook for QCOM? You can find out in our latest intrinsic value infographic research report.
Is QUALCOMM Using Its Retained Earnings Effectively?
QUALCOMM's three-year median payout ratio is a pretty moderate 33%, meaning the company retains 67% of its income. So it seems that QUALCOMM is reinvesting efficiently in a way that it sees impressive growth in its earnings (discussed above) and pays a dividend that's well covered.
Additionally, QUALCOMM has paid dividends over a period of at least ten years which means that the company is pretty serious about sharing its profits with shareholders. Based on the latest analysts' estimates, we found that the company's future payout ratio over the next three years is expected to hold steady at 29%. Regardless, QUALCOMM's ROE is speculated to decline to 37% despite there being no anticipated change in its payout ratio.
Summary
In total, we are pretty happy with QUALCOMM's performance. Particularly, we like that the company is reinvesting heavily into its business, and at a high rate of return. Unsurprisingly, this has led to an impressive earnings growth. Having said that, the company's earnings growth is expected to slow down, as forecasted in the current analyst estimates. To know more about the company's future earnings growth forecasts take a look at this free report on analyst forecasts for the company to find out more.
Mobile Infrastructure for Defense and Disaster
The next wave in robotics isn't humanoid. Its fully autonomous towers delivering 5G, ISR, and radar in under 30 minutes, anywhere.
Get the investor briefing before the next round of contracts
Sponsored On Behalf of CiTechValuation is complex, but we're here to simplify it.
Discover if QUALCOMM might be undervalued or overvalued with our detailed analysis, featuring fair value estimates, potential risks, dividends, insider trades, and its financial condition.
Access Free AnalysisHave feedback on this article? Concerned about the content? Get in touch with us directly. Alternatively, email editorial-team (at) simplywallst.com.
This article by Simply Wall St is general in nature. We provide commentary based on historical data and analyst forecasts only using an unbiased methodology and our articles are not intended to be financial advice. It does not constitute a recommendation to buy or sell any stock, and does not take account of your objectives, or your financial situation. We aim to bring you long-term focused analysis driven by fundamental data. Note that our analysis may not factor in the latest price-sensitive company announcements or qualitative material. Simply Wall St has no position in any stocks mentioned.
About NasdaqGS:QCOM
QUALCOMM
Engages in the development and commercialization of foundational technologies for the wireless industry worldwide.
Flawless balance sheet established dividend payer.
Similar Companies
Market Insights

Weekly Picks

Early mover in a fast growing industry. Likely to experience share price volatility as they scale


A case for CA$31.80 (undiluted), aka 8,616% upside from CA$0.37 (an 86 bagger!).


Moderation and Stabilisation: HOLD: Fair Price based on a 4-year Cycle is $12.08
Recently Updated Narratives


Title: Market Sentiment Is Dead Wrong — Here's Why PSEC Deserves a Second Look


An amazing opportunity to potentially get a 100 bagger

Amazon: Why the World’s Biggest Platform Still Runs on Invisible Economics
Popular Narratives


Crazy Undervalued 42 Baggers Silver Play (Active & Running Mine)


MicroVision will explode future revenue by 380.37% with a vision towards success


NVDA: Expanding AI Demand Will Drive Major Data Center Investments Through 2026
Trending Discussion
