
Advertisement
- United States
- /
- Semiconductors
- /
- NasdaqGS:NVDA
NVIDIA Corporation (NASDAQ:NVDA) Shares Could Be 30% Above Their Intrinsic Value Estimate
Key Insights
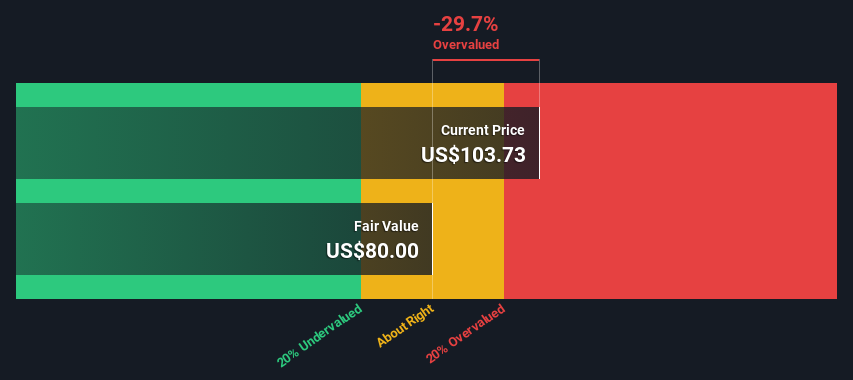
- NVIDIA's estimated fair value is US$80.00 based on 2 Stage Free Cash Flow to Equity
- NVIDIA's US$104 share price signals that it might be 30% overvalued
- Our fair value estimate is 43% lower than NVIDIA's analyst price target of US$139
Today we will run through one way of estimating the intrinsic value of NVIDIA Corporation (NASDAQ:NVDA) by taking the expected future cash flows and discounting them to today's value. The Discounted Cash Flow (DCF) model is the tool we will apply to do this. Don't get put off by the jargon, the math behind it is actually quite straightforward.
We generally believe that a company's value is the present value of all of the cash it will generate in the future. However, a DCF is just one valuation metric among many, and it is not without flaws. Anyone interested in learning a bit more about intrinsic value should have a read of the Simply Wall St analysis model.
View our latest analysis for NVIDIA
Is NVIDIA Fairly Valued?
We're using the 2-stage growth model, which simply means we take in account two stages of company's growth. In the initial period the company may have a higher growth rate and the second stage is usually assumed to have a stable growth rate. To begin with, we have to get estimates of the next ten years of cash flows. Where possible we use analyst estimates, but when these aren't available we extrapolate the previous free cash flow (FCF) from the last estimate or reported value. We assume companies with shrinking free cash flow will slow their rate of shrinkage, and that companies with growing free cash flow will see their growth rate slow, over this period. We do this to reflect that growth tends to slow more in the early years than it does in later years.
Generally we assume that a dollar today is more valuable than a dollar in the future, and so the sum of these future cash flows is then discounted to today's value:
10-year free cash flow (FCF) estimate
| 2025 | 2026 | 2027 | 2028 | 2029 | 2030 | 2031 | 2032 | 2033 | 2034 | |
| Levered FCF ($, Millions) | US$59.3b | US$79.8b | US$92.5b | US$118.7b | US$128.7b | US$136.3b | US$142.9b | US$148.8b | US$154.2b | US$159.2b |
| Growth Rate Estimate Source | Analyst x14 | Analyst x13 | Analyst x6 | Analyst x1 | Analyst x1 | Est @ 5.92% | Est @ 4.86% | Est @ 4.11% | Est @ 3.59% | Est @ 3.23% |
| Present Value ($, Millions) Discounted @ 8.4% | US$54.7k | US$67.9k | US$72.6k | US$86.0k | US$86.0k | US$84.0k | US$81.3k | US$78.1k | US$74.6k | US$71.1k |
("Est" = FCF growth rate estimated by Simply Wall St)
Present Value of 10-year Cash Flow (PVCF) = US$756b
The second stage is also known as Terminal Value, this is the business's cash flow after the first stage. The Gordon Growth formula is used to calculate Terminal Value at a future annual growth rate equal to the 5-year average of the 10-year government bond yield of 2.4%. We discount the terminal cash flows to today's value at a cost of equity of 8.4%.
Terminal Value (TV)= FCF2034 × (1 + g) ÷ (r – g) = US$159b× (1 + 2.4%) ÷ (8.4%– 2.4%) = US$2.7t
Present Value of Terminal Value (PVTV)= TV / (1 + r)10= US$2.7t÷ ( 1 + 8.4%)10= US$1.2t
The total value, or equity value, is then the sum of the present value of the future cash flows, which in this case is US$2.0t. In the final step we divide the equity value by the number of shares outstanding. Relative to the current share price of US$104, the company appears slightly overvalued at the time of writing. Valuations are imprecise instruments though, rather like a telescope - move a few degrees and end up in a different galaxy. Do keep this in mind.
Important Assumptions
Now the most important inputs to a discounted cash flow are the discount rate, and of course, the actual cash flows. You don't have to agree with these inputs, I recommend redoing the calculations yourself and playing with them. The DCF also does not consider the possible cyclicality of an industry, or a company's future capital requirements, so it does not give a full picture of a company's potential performance. Given that we are looking at NVIDIA as potential shareholders, the cost of equity is used as the discount rate, rather than the cost of capital (or weighted average cost of capital, WACC) which accounts for debt. In this calculation we've used 8.4%, which is based on a levered beta of 1.308. Beta is a measure of a stock's volatility, compared to the market as a whole. We get our beta from the industry average beta of globally comparable companies, with an imposed limit between 0.8 and 2.0, which is a reasonable range for a stable business.
SWOT Analysis for NVIDIA
Strength
- Earnings growth over the past year exceeded the industry.
- Debt is not viewed as a risk.
Weakness
- Dividend is low compared to the top 25% of dividend payers in the Semiconductor market.
Opportunity
- Annual earnings are forecast to grow faster than the American market.
- Good value based on P/E ratio compared to estimated Fair P/E ratio.
Threat
- No apparent threats visible for NVDA.
Next Steps:
Whilst important, the DCF calculation shouldn't be the only metric you look at when researching a company. DCF models are not the be-all and end-all of investment valuation. Preferably you'd apply different cases and assumptions and see how they would impact the company's valuation. If a company grows at a different rate, or if its cost of equity or risk free rate changes sharply, the output can look very different. Why is the intrinsic value lower than the current share price? For NVIDIA, we've put together three further factors you should assess:
- Risks: For example, we've discovered 1 warning sign for NVIDIA that you should be aware of before investing here.
- Future Earnings: How does NVDA's growth rate compare to its peers and the wider market? Dig deeper into the analyst consensus number for the upcoming years by interacting with our free analyst growth expectation chart.
- Other Solid Businesses: Low debt, high returns on equity and good past performance are fundamental to a strong business. Why not explore our interactive list of stocks with solid business fundamentals to see if there are other companies you may not have considered!
PS. The Simply Wall St app conducts a discounted cash flow valuation for every stock on the NASDAQGS every day. If you want to find the calculation for other stocks just search here.
Valuation is complex, but we're here to simplify it.
Discover if NVIDIA might be undervalued or overvalued with our detailed analysis, featuring fair value estimates, potential risks, dividends, insider trades, and its financial condition.
Access Free AnalysisHave feedback on this article? Concerned about the content? Get in touch with us directly. Alternatively, email editorial-team (at) simplywallst.com.
This article by Simply Wall St is general in nature. We provide commentary based on historical data and analyst forecasts only using an unbiased methodology and our articles are not intended to be financial advice. It does not constitute a recommendation to buy or sell any stock, and does not take account of your objectives, or your financial situation. We aim to bring you long-term focused analysis driven by fundamental data. Note that our analysis may not factor in the latest price-sensitive company announcements or qualitative material. Simply Wall St has no position in any stocks mentioned.
Have feedback on this article? Concerned about the content? Get in touch with us directly. Alternatively, email editorial-team@simplywallst.com
About NasdaqGS:NVDA
NVIDIA
A computing infrastructure company, provides graphics and compute and networking solutions in the United States, Singapore, Taiwan, China, Hong Kong, and internationally.
Flawless balance sheet with high growth potential.
Similar Companies
Market Insights


Advertisement
Community Narratives
MicroStrategy: Volatile Gamble or Golden Opportunity?
Fair Value US$663.00|31.2% undervalued
BL
Community Contributor
Emerging Markets and Debt Reduction Will Propel Bath & Body Works Forward
Fair Value US$40.73|24.4% undervalued
ZW
Community Contributor
An amazing opportunity to potentially get a 100 bagger
Fair Value US$10.00|13.5% overvalued
DA
Community Contributor