
Advertisement
Should You Be Tempted To Sell Maxim Integrated Products, Inc. (NASDAQ:MXIM) Because Of Its P/E Ratio?

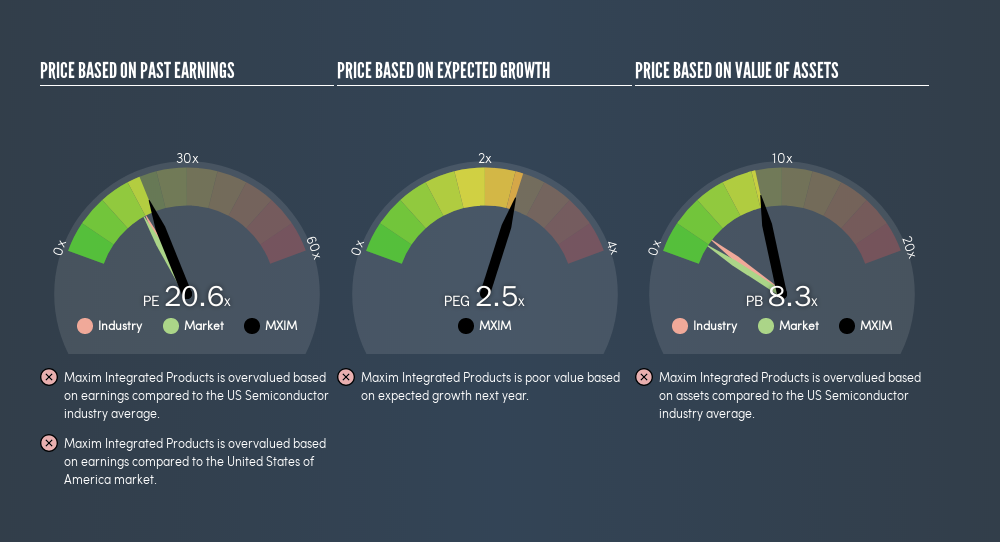
The goal of this article is to teach you how to use price to earnings ratios (P/E ratios). We'll show how you can use Maxim Integrated Products, Inc.'s (NASDAQ:MXIM) P/E ratio to inform your assessment of the investment opportunity. Based on the last twelve months, Maxim Integrated Products's P/E ratio is 20.57. That is equivalent to an earnings yield of about 4.9%.
Check out our latest analysis for Maxim Integrated Products
How Do I Calculate Maxim Integrated Products's Price To Earnings Ratio?
The formula for P/E is:
Price to Earnings Ratio = Price per Share ÷ Earnings per Share (EPS)
Or for Maxim Integrated Products:
P/E of 20.57 = $52.94 ÷ $2.57 (Based on the year to December 2018.)
Is A High Price-to-Earnings Ratio Good?
A higher P/E ratio means that buyers have to pay a higher price for each $1 the company has earned over the last year. That isn't a good or a bad thing on its own, but a high P/E means that buyers have a higher opinion of the business's prospects, relative to stocks with a lower P/E.
How Growth Rates Impact P/E Ratios
Probably the most important factor in determining what P/E a company trades on is the earnings growth. Earnings growth means that in the future the 'E' will be higher. That means unless the share price increases, the P/E will reduce in a few years. A lower P/E should indicate the stock is cheap relative to others -- and that may attract buyers.
Notably, Maxim Integrated Products grew EPS by a whopping 89% in the last year. And its annual EPS growth rate over 5 years is 18%. I'd therefore be a little surprised if its P/E ratio was not relatively high.
How Does Maxim Integrated Products's P/E Ratio Compare To Its Peers?
The P/E ratio indicates whether the market has higher or lower expectations of a company. You can see in the image below that the average P/E (18.3) for companies in the semiconductor industry is lower than Maxim Integrated Products's P/E.
That means that the market expects Maxim Integrated Products will outperform other companies in its industry. The market is optimistic about the future, but that doesn't guarantee future growth. So investors should delve deeper. I like to check if company insiders have been buying or selling.
A Limitation: P/E Ratios Ignore Debt and Cash In The Bank
The 'Price' in P/E reflects the market capitalization of the company. That means it doesn't take debt or cash into account. Theoretically, a business can improve its earnings (and produce a lower P/E in the future), by taking on debt (or spending its remaining cash).
Spending on growth might be good or bad a few years later, but the point is that the P/E ratio does not account for the option (or lack thereof).
Is Debt Impacting Maxim Integrated Products's P/E?
Maxim Integrated Products has net cash of US$969m. That should lead to a higher P/E than if it did have debt, because its strong balance sheets gives it more options.
The Verdict On Maxim Integrated Products's P/E Ratio
Maxim Integrated Products trades on a P/E ratio of 20.6, which is above the US market average of 17.6. With cash in the bank the company has plenty of growth options -- and it is already on the right track. So it is not surprising the market is probably extrapolating recent growth well into the future, reflected in the relatively high P/E ratio.
Investors should be looking to buy stocks that the market is wrong about. People often underestimate remarkable growth -- so investors can make money when fast growth is not fully appreciated. So this freereport on the analyst consensus forecasts could help you make a master move on this stock.
But note: Maxim Integrated Products may not be the best stock to buy. So take a peek at this freelist of interesting companies with strong recent earnings growth (and a P/E ratio below 20).
We aim to bring you long-term focused research analysis driven by fundamental data. Note that our analysis may not factor in the latest price-sensitive company announcements or qualitative material.
If you spot an error that warrants correction, please contact the editor at editorial-team@simplywallst.com. This article by Simply Wall St is general in nature. It does not constitute a recommendation to buy or sell any stock, and does not take account of your objectives, or your financial situation. Simply Wall St has no position in the stocks mentioned. Thank you for reading.
Market Insights


Advertisement
Community Narratives
The Future of Drug Testing? Fingerprint Tech Shows Serious Promise
Fair Value US$2.98|40.3% undervalued
JO
Community Contributor
Suncorp’s Next Chapter: Insurance-Only and Ready to Grow
Fair Value AU$22.83|7.9% undervalued
RO
Community Contributor
Thyssenkrupp Nucera Will Achieve Double-Digit Profits by 2030 Boosted by Hydrogen Growth
Fair Value €14.40|31.6% undervalued
CH
Community Contributor
Tesla’s Nvidia Moment – The AI & Robotics Inflection Point
Fair Value US$359.72|12.3% undervalued
BL
Community Contributor