- United States
- /
- Semiconductors
- /
- NasdaqGS:KLIC
Kulicke and Soffa Industries, Inc.'s (NASDAQ:KLIC) Intrinsic Value Is Potentially 84% Above Its Share Price


In this article we are going to estimate the intrinsic value of Kulicke and Soffa Industries, Inc. (NASDAQ:KLIC) by taking the forecast future cash flows of the company and discounting them back to today's value. This will be done using the Discounted Cash Flow (DCF) model. Don't get put off by the jargon, the math behind it is actually quite straightforward.
Remember though, that there are many ways to estimate a company's value, and a DCF is just one method. Anyone interested in learning a bit more about intrinsic value should have a read of the Simply Wall St analysis model.
See our latest analysis for Kulicke and Soffa Industries
What's the estimated valuation?
We are going to use a two-stage DCF model, which, as the name states, takes into account two stages of growth. The first stage is generally a higher growth period which levels off heading towards the terminal value, captured in the second 'steady growth' period. To begin with, we have to get estimates of the next ten years of cash flows. Seeing as no analyst estimates of free cash flow are available to us, we have extrapolate the previous free cash flow (FCF) from the company's last reported value. We assume companies with shrinking free cash flow will slow their rate of shrinkage, and that companies with growing free cash flow will see their growth rate slow, over this period. We do this to reflect that growth tends to slow more in the early years than it does in later years.
A DCF is all about the idea that a dollar in the future is less valuable than a dollar today, so we need to discount the sum of these future cash flows to arrive at a present value estimate:
10-year free cash flow (FCF) forecast
| 2022 | 2023 | 2024 | 2025 | 2026 | 2027 | 2028 | 2029 | 2030 | 2031 | |
| Levered FCF ($, Millions) | US$239.1m | US$288.6m | US$332.2m | US$369.3m | US$400.4m | US$426.3m | US$448.2m | US$467.0m | US$483.5m | US$498.4m |
| Growth Rate Estimate Source | Est @ 28.73% | Est @ 20.71% | Est @ 15.09% | Est @ 11.16% | Est @ 8.41% | Est @ 6.48% | Est @ 5.14% | Est @ 4.19% | Est @ 3.53% | Est @ 3.07% |
| Present Value ($, Millions) Discounted @ 7.3% | US$223 | US$251 | US$269 | US$279 | US$282 | US$280 | US$274 | US$266 | US$257 | US$247 |
("Est" = FCF growth rate estimated by Simply Wall St)
Present Value of 10-year Cash Flow (PVCF) = US$2.6b
After calculating the present value of future cash flows in the initial 10-year period, we need to calculate the Terminal Value, which accounts for all future cash flows beyond the first stage. The Gordon Growth formula is used to calculate Terminal Value at a future annual growth rate equal to the 5-year average of the 10-year government bond yield of 2.0%. We discount the terminal cash flows to today's value at a cost of equity of 7.3%.
Terminal Value (TV)= FCF2031 × (1 + g) ÷ (r – g) = US$498m× (1 + 2.0%) ÷ (7.3%– 2.0%) = US$9.6b
Present Value of Terminal Value (PVTV)= TV / (1 + r)10= US$9.6b÷ ( 1 + 7.3%)10= US$4.8b
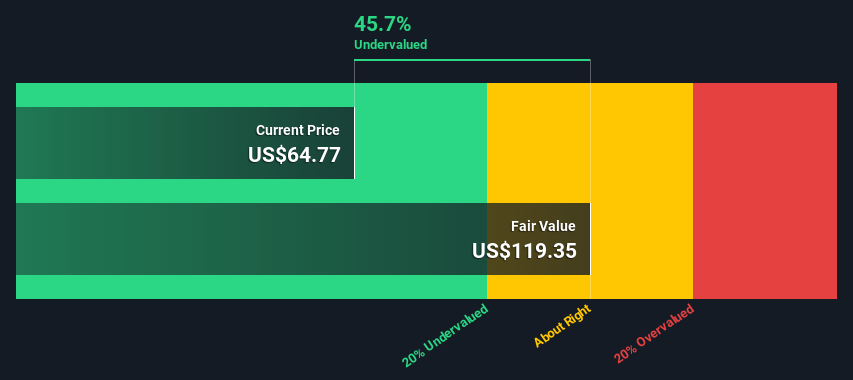
The total value, or equity value, is then the sum of the present value of the future cash flows, which in this case is US$7.4b. To get the intrinsic value per share, we divide this by the total number of shares outstanding. Relative to the current share price of US$64.8, the company appears quite good value at a 46% discount to where the stock price trades currently. Valuations are imprecise instruments though, rather like a telescope - move a few degrees and end up in a different galaxy. Do keep this in mind.
The assumptions
We would point out that the most important inputs to a discounted cash flow are the discount rate and of course the actual cash flows. Part of investing is coming up with your own evaluation of a company's future performance, so try the calculation yourself and check your own assumptions. The DCF also does not consider the possible cyclicality of an industry, or a company's future capital requirements, so it does not give a full picture of a company's potential performance. Given that we are looking at Kulicke and Soffa Industries as potential shareholders, the cost of equity is used as the discount rate, rather than the cost of capital (or weighted average cost of capital, WACC) which accounts for debt. In this calculation we've used 7.3%, which is based on a levered beta of 1.119. Beta is a measure of a stock's volatility, compared to the market as a whole. We get our beta from the industry average beta of globally comparable companies, with an imposed limit between 0.8 and 2.0, which is a reasonable range for a stable business.
Moving On:
Whilst important, the DCF calculation ideally won't be the sole piece of analysis you scrutinize for a company. It's not possible to obtain a foolproof valuation with a DCF model. Instead the best use for a DCF model is to test certain assumptions and theories to see if they would lead to the company being undervalued or overvalued. For example, changes in the company's cost of equity or the risk free rate can significantly impact the valuation. Why is the intrinsic value higher than the current share price? For Kulicke and Soffa Industries, we've put together three relevant factors you should assess:
- Risks: For example, we've discovered 4 warning signs for Kulicke and Soffa Industries (2 shouldn't be ignored!) that you should be aware of before investing here.
- Management:Have insiders been ramping up their shares to take advantage of the market's sentiment for KLIC's future outlook? Check out our management and board analysis with insights on CEO compensation and governance factors.
- Other High Quality Alternatives: Do you like a good all-rounder? Explore our interactive list of high quality stocks to get an idea of what else is out there you may be missing!
PS. The Simply Wall St app conducts a discounted cash flow valuation for every stock on the NASDAQGS every day. If you want to find the calculation for other stocks just search here.
If you’re looking to trade Kulicke and Soffa Industries, open an account with the lowest-cost* platform trusted by professionals, Interactive Brokers. Their clients from over 200 countries and territories trade stocks, options, futures, forex, bonds and funds worldwide from a single integrated account. Promoted
Valuation is complex, but we're here to simplify it.
Discover if Kulicke and Soffa Industries might be undervalued or overvalued with our detailed analysis, featuring fair value estimates, potential risks, dividends, insider trades, and its financial condition.
Access Free AnalysisThis article by Simply Wall St is general in nature. We provide commentary based on historical data and analyst forecasts only using an unbiased methodology and our articles are not intended to be financial advice. It does not constitute a recommendation to buy or sell any stock, and does not take account of your objectives, or your financial situation. We aim to bring you long-term focused analysis driven by fundamental data. Note that our analysis may not factor in the latest price-sensitive company announcements or qualitative material. Simply Wall St has no position in any stocks mentioned.
*Interactive Brokers Rated Lowest Cost Broker by StockBrokers.com Annual Online Review 2020
Have feedback on this article? Concerned about the content? Get in touch with us directly. Alternatively, email editorial-team (at) simplywallst.com.
About NasdaqGS:KLIC
Kulicke and Soffa Industries
Engages in the design, manufacture, and sale of capital equipment and tools used to assemble semiconductor devices.
Flawless balance sheet with reasonable growth potential.
Similar Companies
Market Insights

Community Narratives

