- United States
- /
- Semiconductors
- /
- NasdaqGS:HIMX
Returns At Himax Technologies (NASDAQ:HIMX) Are On The Way Up

There are a few key trends to look for if we want to identify the next multi-bagger. Typically, we'll want to notice a trend of growing return on capital employed (ROCE) and alongside that, an expanding base of capital employed. Ultimately, this demonstrates that it's a business that is reinvesting profits at increasing rates of return. With that in mind, we've noticed some promising trends at Himax Technologies (NASDAQ:HIMX) so let's look a bit deeper.
What Is Return On Capital Employed (ROCE)?
For those that aren't sure what ROCE is, it measures the amount of pre-tax profits a company can generate from the capital employed in its business. To calculate this metric for Himax Technologies, this is the formula:
Return on Capital Employed = Earnings Before Interest and Tax (EBIT) ÷ (Total Assets - Current Liabilities)
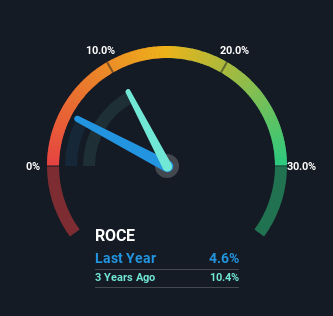
0.046 = US$43m ÷ (US$1.6b - US$709m) (Based on the trailing twelve months to December 2023).
Thus, Himax Technologies has an ROCE of 4.6%. In absolute terms, that's a low return and it also under-performs the Semiconductor industry average of 11%.
See our latest analysis for Himax Technologies
In the above chart we have measured Himax Technologies' prior ROCE against its prior performance, but the future is arguably more important. If you'd like, you can check out the forecasts from the analysts covering Himax Technologies for free.
So How Is Himax Technologies' ROCE Trending?
We're glad to see that ROCE is heading in the right direction, even if it is still low at the moment. The numbers show that in the last five years, the returns generated on capital employed have grown considerably to 4.6%. Basically the business is earning more per dollar of capital invested and in addition to that, 110% more capital is being employed now too. So we're very much inspired by what we're seeing at Himax Technologies thanks to its ability to profitably reinvest capital.
On a separate but related note, it's important to know that Himax Technologies has a current liabilities to total assets ratio of 43%, which we'd consider pretty high. This can bring about some risks because the company is basically operating with a rather large reliance on its suppliers or other sorts of short-term creditors. Ideally we'd like to see this reduce as that would mean fewer obligations bearing risks.
The Key Takeaway
All in all, it's terrific to see that Himax Technologies is reaping the rewards from prior investments and is growing its capital base. And with the stock having performed exceptionally well over the last five years, these patterns are being accounted for by investors. In light of that, we think it's worth looking further into this stock because if Himax Technologies can keep these trends up, it could have a bright future ahead.
One more thing to note, we've identified 2 warning signs with Himax Technologies and understanding them should be part of your investment process.
For those who like to invest in solid companies, check out this free list of companies with solid balance sheets and high returns on equity.
The New Payments ETF Is Live on NASDAQ:
Money is moving to real-time rails, and a newly listed ETF now gives investors direct exposure. Fast settlement. Institutional custody. Simple access.
Explore how this launch could reshape portfolios
Sponsored ContentValuation is complex, but we're here to simplify it.
Discover if Himax Technologies might be undervalued or overvalued with our detailed analysis, featuring fair value estimates, potential risks, dividends, insider trades, and its financial condition.
Access Free AnalysisHave feedback on this article? Concerned about the content? Get in touch with us directly. Alternatively, email editorial-team (at) simplywallst.com.
This article by Simply Wall St is general in nature. We provide commentary based on historical data and analyst forecasts only using an unbiased methodology and our articles are not intended to be financial advice. It does not constitute a recommendation to buy or sell any stock, and does not take account of your objectives, or your financial situation. We aim to bring you long-term focused analysis driven by fundamental data. Note that our analysis may not factor in the latest price-sensitive company announcements or qualitative material. Simply Wall St has no position in any stocks mentioned.
About NasdaqGS:HIMX
Himax Technologies
A fabless semiconductor company, provides display imaging processing technologies in China, Taiwan, Korea, Japan, the United States, and internationally.
Excellent balance sheet established dividend payer.
Similar Companies
Market Insights

Weekly Picks

Early mover in a fast growing industry. Likely to experience share price volatility as they scale


A case for CA$31.80 (undiluted), aka 8,616% upside from CA$0.37 (an 86 bagger!).


Moderation and Stabilisation: HOLD: Fair Price based on a 4-year Cycle is $12.08
Recently Updated Narratives

Airbnb Stock: Platform Growth in a World of Saturation and Scrutiny

Adobe Stock: AI-Fueled ARR Growth Pushes Guidance Higher, But Cost Pressures Loom

Thomson Reuters Stock: When Legal Intelligence Becomes Mission-Critical Infrastructure
Popular Narratives


Crazy Undervalued 42 Baggers Silver Play (Active & Running Mine)


NVDA: Expanding AI Demand Will Drive Major Data Center Investments Through 2026

The AI Infrastructure Giant Grows Into Its Valuation
Trending Discussion


