Advertisement
- United States
- /
- Semiconductors
- /
- NasdaqGS:AVGO
Is Broadcom Still a Good Value After AI Partnerships and 92% One Year Rise?

Simply Wall St
Reviewed by Bailey Pemberton
- Wondering if Broadcom is still a bargain, or if you might be catching the stock after its prime? Let’s dig into what really matters for value-focused investors.
- Broadcom’s share price has surged by 92.1% over the past year and a staggering 946.8% over five years, with gains of 50.6% year-to-date. However, it dipped 5.5% this week.
- Market excitement picked up following headlines about Broadcom’s continued push into AI infrastructure. Industry watchers have highlighted new partnerships and product launches, and these strategic moves have refueled bullish sentiment and helped explain the latest momentum in the stock price.
- But when you check our valuation score for Broadcom, it sits at 0 out of 6. Before you make any moves, let’s walk through the major valuation approaches in detail and stick around for a perspective at the end that might change how you look at value completely.
Broadcom scores just 0/6 on our valuation checks. See what other red flags we found in the full valuation breakdown.
Approach 1: Broadcom Discounted Cash Flow (DCF) Analysis
A Discounted Cash Flow (DCF) model estimates a company's value by projecting how much cash it will generate in the future and then discounting those amounts back to today's value. This method aims to provide an intrinsic worth for the business based on expected future performance rather than current market hype.
For Broadcom, the most up-to-date DCF model uses Free Cash Flow (FCF) as its key metric. The company's latest reported FCF stands at $24.80 billion. Analysts offer explicit cash flow estimates for the next five years, with further projections after that extrapolated to 2035. According to these estimates, Broadcom’s FCF could reach $94.10 billion by 2029. The forecast continues to climb, suggesting robust cash generation driven by the company's investments and innovations.
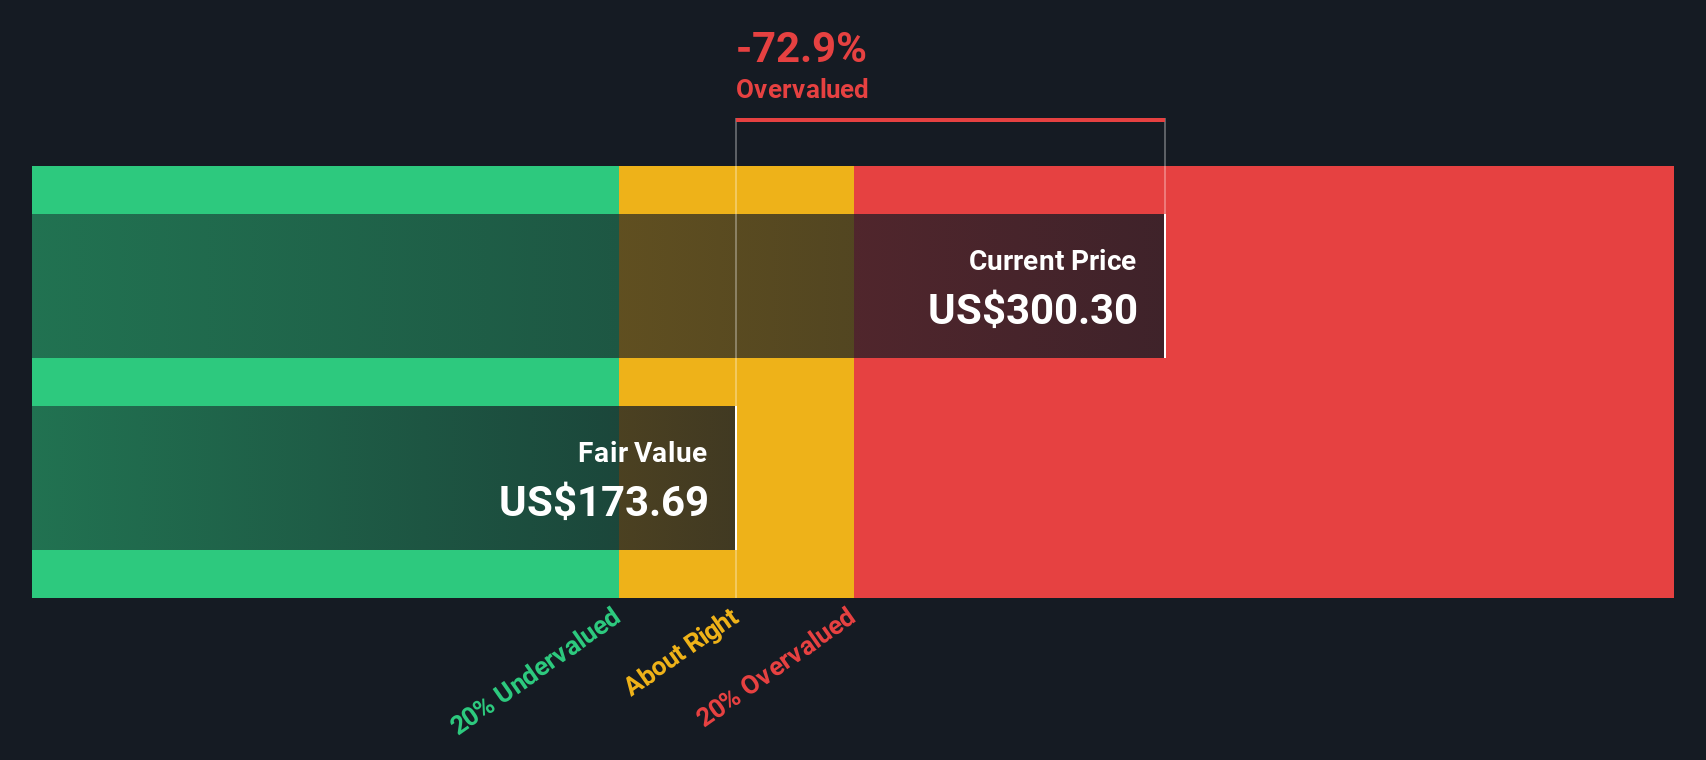
Simply Wall St's two-stage DCF model calculates an intrinsic share value of $300.15. However, comparing this to the current market price shows the stock trades at a premium, with an implied downside of 16.4%. This means Broadcom is considered 16.4% overvalued on a DCF basis.
Result: OVERVALUED
Our Discounted Cash Flow (DCF) analysis suggests Broadcom may be overvalued by 16.4%. Discover 870 undervalued stocks or create your own screener to find better value opportunities.
Approach 2: Broadcom Price vs Earnings (PE)
The price-to-earnings (PE) ratio is a classic valuation metric, especially relevant for established, profitable companies like Broadcom. It reflects how much investors are willing to pay today for a dollar of Broadcom’s earnings, making it a quick way to gauge value based on actual profits.
Higher expected growth rates can justify a loftier PE, while more risk or slower growth calls for a lower ratio. That is why context matters. Benchmarking against both peers and the broader industry helps, but can miss company-specific strengths or weaknesses.
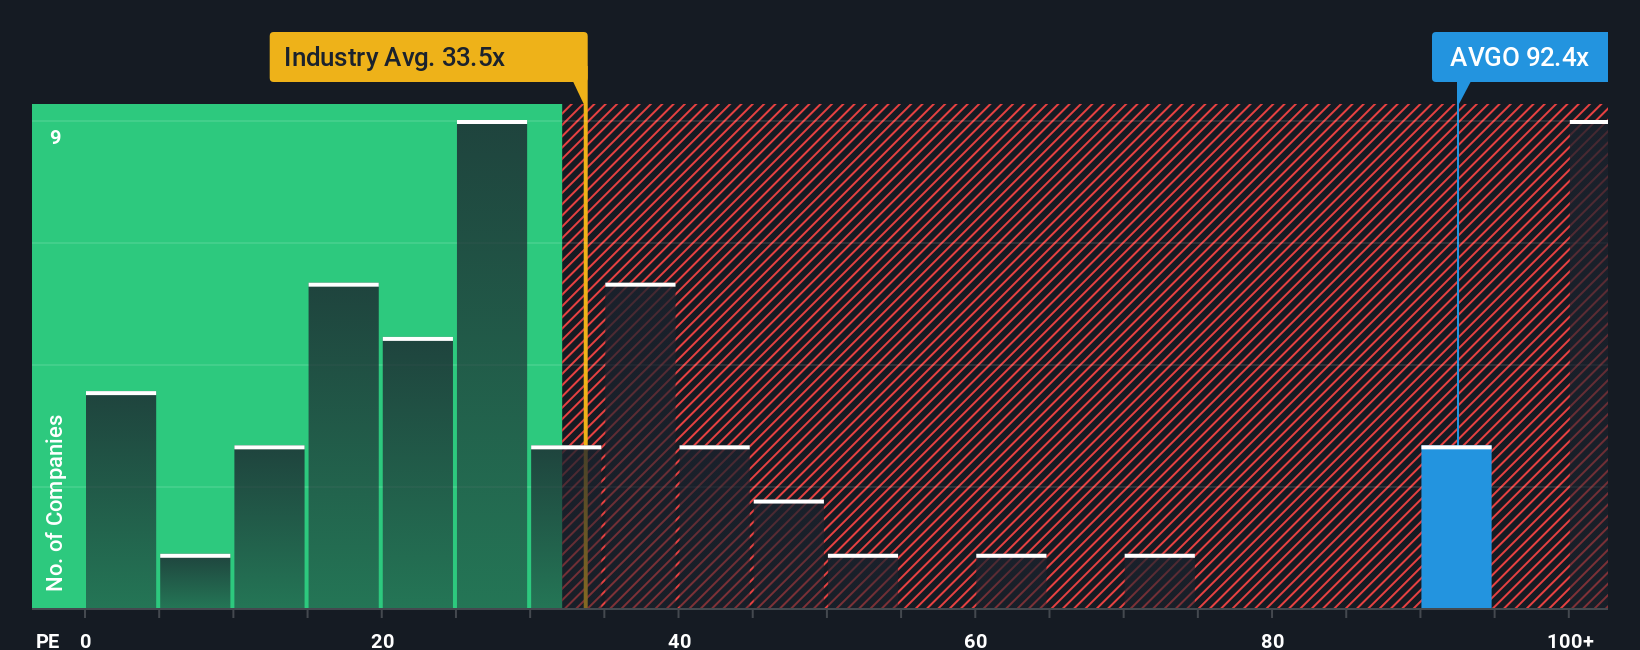
Broadcom currently trades at a PE of 87.7x, considerably above the semiconductor industry average of 35.4x and also higher than the average of its direct peers at 59.6x. At first glance, this might suggest the stock is expensive by typical standards.
This is where Simply Wall St’s Fair Ratio comes into play. The Fair Ratio is a bespoke multiple that factors in unique elements like Broadcom’s earnings growth prospects, profit margins, market cap, risk profile, and sector dynamics. Unlike simple peer or industry comparisons, the Fair Ratio aims to provide a more tailored and holistic benchmark that reflects what investors should reasonably pay for Broadcom today.
Broadcom’s Fair Ratio is calculated at 67.0x. With the actual PE at 87.7x, this is a significant premium, suggesting the stock remains overvalued even after accounting for its advantages.
Result: OVERVALUED
PE ratios tell one story, but what if the real opportunity lies elsewhere? Discover 1396 companies where insiders are betting big on explosive growth.
Upgrade Your Decision Making: Choose your Broadcom Narrative
Earlier we mentioned that there's an even better way to understand valuation, so let's introduce you to Narratives. A Narrative is a simple but powerful way to connect your view of Broadcom’s future, whether it is optimistic about AI-driven growth or cautious due to competition, to the actual financial forecasts and the fair value you believe is justified.
With Narratives, you can document your reasoning behind expected revenue, earnings, and margin trends, linking the company’s story to a tailored set of numbers. This approach transforms investment decisions from purely numbers-based to data-driven stories that reflect your perspective, and it is right at your fingertips on Simply Wall St’s Community page where millions of investors share theirs.
Narratives make it easy to decide whether to buy or sell: by comparing your calculated Fair Value against Broadcom’s current price, you can see if there is a potential opportunity or risk. Plus, Narratives update automatically as new information (from news, earnings, or industry events) emerges, keeping your investment thinking up to date.
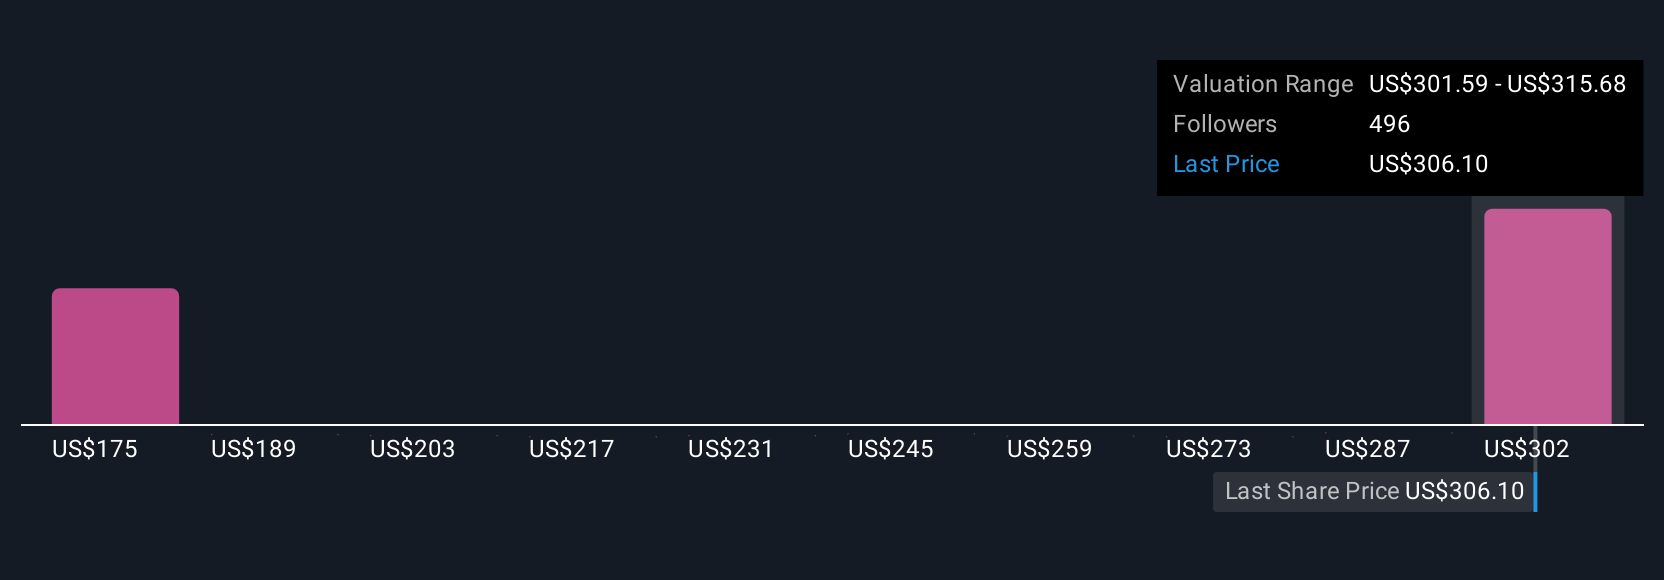
For Broadcom, investors’ Narratives vary widely. Some expect future earnings as high as $50.8 billion and target prices above $415, while others see earnings closer to $34.6 billion and price targets as low as $218, all depending on how each investor interprets the company’s evolving story.
Do you think there's more to the story for Broadcom? Head over to our Community to see what others are saying!
This article by Simply Wall St is general in nature. We provide commentary based on historical data and analyst forecasts only using an unbiased methodology and our articles are not intended to be financial advice. It does not constitute a recommendation to buy or sell any stock, and does not take account of your objectives, or your financial situation. We aim to bring you long-term focused analysis driven by fundamental data. Note that our analysis may not factor in the latest price-sensitive company announcements or qualitative material. Simply Wall St has no position in any stocks mentioned.
Valuation is complex, but we're here to simplify it.
Discover if Broadcom might be undervalued or overvalued with our detailed analysis, featuring fair value estimates, potential risks, dividends, insider trades, and its financial condition.
Access Free AnalysisHave feedback on this article? Concerned about the content? Get in touch with us directly. Alternatively, email editorial-team@simplywallst.com
About NasdaqGS:AVGO
Broadcom
Designs, develops, and supplies various semiconductor devices and infrastructure software solutions worldwide.
Exceptional growth potential with outstanding track record.
Similar Companies
Market Insights

Advertisement
Community Narratives
MINISO's fair value is projected at 26.69 with an anticipated PE ratio shift of 20x
Fair Value US$24.03|11.0% undervalued
BE
Community Contributor
Procter & Gamble: A Dividend Giant Facing Slowing Growth
Fair Value US$119.81|23.3% overvalued
AN
Community Contributor
Eli Lilly's Future Growth Driven by Tirzepatide and Favorable Market Conditions
Fair Value US$1.19k|13.8% undervalued
EA
Community Contributor