Advertisement
- United States
- /
- Semiconductors
- /
- NasdaqGS:AVGO
How Should Investors Approach Broadcom Shares After 106% Surge and Software Expansion?

Simply Wall St
Reviewed by Bailey Pemberton
Thinking about what to do with Broadcom stock right now? You’re certainly not alone. With the company’s share price up a staggering 106.7% over the past year and more than 1,000% over the last five years, Broadcom’s momentum has turned plenty of heads. In just the past month, shares have tacked on another 4.4%, riding optimism that continues to build in the semiconductor space. Global investment in AI, sustained demand for networking hardware, and Broadcom’s ongoing portfolio evolution have all played a role in this impressive run.
Recent headlines have added to the excitement, including Broadcom’s push to expand its software business and strategic acquisitions that align with major tech trends. These moves have helped reinforce the narrative that Broadcom is more than just a chipmaker, and they hint at future growth the market is starting to factor in. Still, not all that glitters is necessarily undervalued. This brings us to the numbers: Broadcom currently scores a 0 on our valuation check system, meaning it isn’t viewed as undervalued in any of the six major ways analysts measure a bargain.
What goes into that valuation score, and does it paint the full picture? Let’s dive deeper into the different frameworks investors use to understand if Broadcom still has room to run or if expectations have simply gotten ahead of reality. And, as you’ll see by the end of this piece, there is an even more insightful way to look at Broadcom’s true value in today’s market.
Broadcom scores just 0/6 on our valuation checks. See what other red flags we found in the full valuation breakdown.
Approach 1: Broadcom Discounted Cash Flow (DCF) Analysis
A Discounted Cash Flow (DCF) model estimates the intrinsic value of a company by projecting its future cash flows and discounting them back to today’s value. This method is popular among analysts because it focuses on real money the company can generate for shareholders, rather than just earnings or revenues.
For Broadcom, the most recent annual Free Cash Flow stands at $24.8 billion. Analysts expect robust growth in the coming years and project cash flow to reach $94.1 billion by 2029. After that, Simply Wall St extrapolates these forecasts and suggests Free Cash Flow could top $169.3 billion by 2035. All these figures are in US dollars and highlight Broadcom’s reputation as a cash-generating powerhouse.
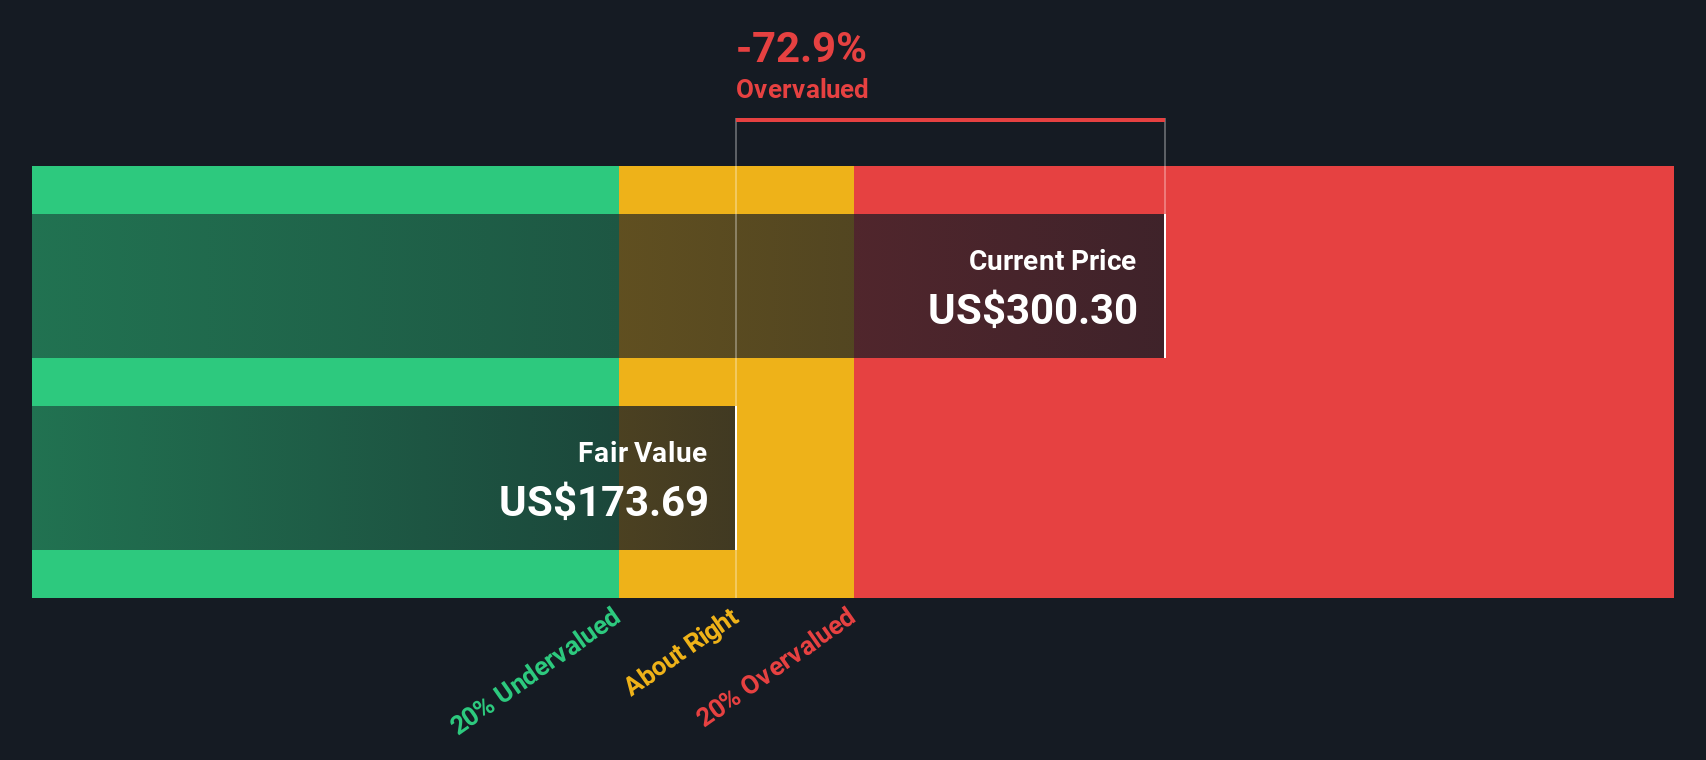
Based on these projections, Broadcom’s DCF fair value estimate is $324.97 per share. With the current share price about 9.0% above this intrinsic value, the DCF model suggests the stock is modestly overvalued at the moment.
Result: ABOUT RIGHT
Simply Wall St performs a valuation analysis on every stock in the world every day (check out Broadcom's valuation analysis). We show the entire calculation in full. You can track the result in your watchlist or portfolio and be alerted when this changes.
Approach 2: Broadcom Price vs Earnings
The Price-to-Earnings (PE) ratio is the preferred multiple for profitable companies like Broadcom because it directly links a company’s share price to its earnings power. This metric is especially relevant for established firms with consistent profits, as it helps investors assess how much they are paying for each dollar of earnings today. Generally, a higher PE ratio can be justified when investors expect robust earnings growth and lower risk. In contrast, a lower PE reflects more modest growth prospects or greater uncertainty.
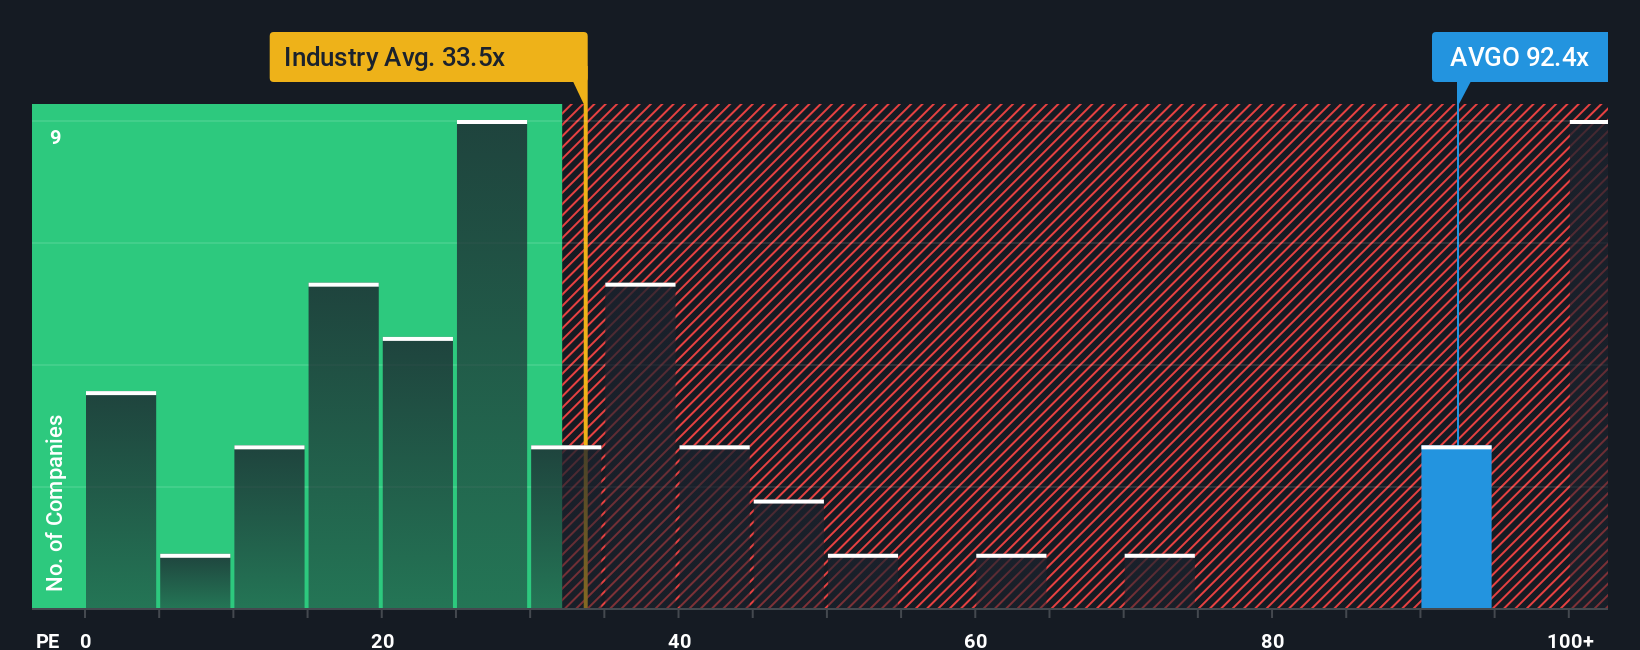
At present, Broadcom trades at a PE ratio of 88.9x, which is notably higher than the semiconductor industry average of 39.5x and also above its peer average of 61.8x. While these comparisons can give a general sense of market sentiment, they do not account for company-specific factors that might justify a premium or discount.
This is where Simply Wall St's proprietary "Fair Ratio" becomes more insightful. Unlike simple peer or industry averages, the Fair Ratio considers a blend of Broadcom’s expected earnings growth, profit margins, industry characteristics, company size, and risk profile. For Broadcom, the Fair Ratio stands at 62.2x. This suggests Broadcom’s elevated PE is only modestly above where you might expect, given all its strengths and attributes. Since the gap between the Fair Ratio and Broadcom’s actual PE is less than 0.10 in absolute difference, the stock appears neither significantly undervalued nor overvalued on this measure.
Result: ABOUT RIGHT
PE ratios tell one story, but what if the real opportunity lies elsewhere? Discover companies where insiders are betting big on explosive growth.
Upgrade Your Decision Making: Choose your Broadcom Narrative
Earlier we mentioned there is an even better way to understand valuation, so let's introduce you to Narratives. Narratives are a simple but powerful investment tool that lets you express your point of view on a company by connecting the story you believe in, such as Broadcom’s growth in AI, its software expansion, or sector challenges, with your own forecast for revenue, earnings, and profit margins in the years ahead. Unlike traditional models or ratios, Narratives directly link your story about Broadcom to a concrete financial forecast and an automatically calculated fair value.
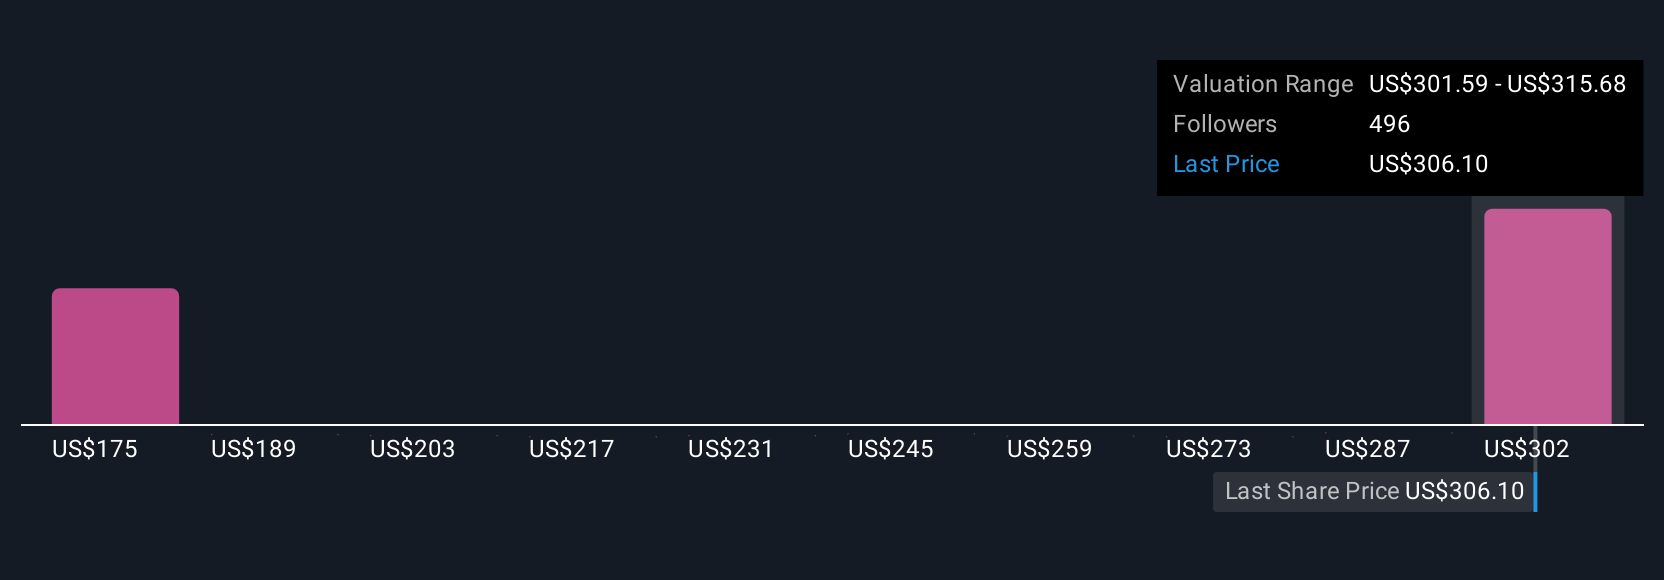
On Simply Wall St’s Community page, which is used by millions of investors globally, Narratives make it easy to adjust your own expectations, see others' forecasts at a glance, and decide if you think Broadcom’s current share price is compelling. The real power comes as Narratives are updated automatically whenever new earnings reports or news emerge, allowing your view (and fair value estimate) to evolve in real time.
For Broadcom, one investor might be optimistic, expecting continued AI chip momentum and successful VMware integration, leading to a fair value as high as $460 per share, while another may focus on risks like competitive threats and set their target closer to $218. Narratives empower you to clearly compare your personal outlook to both consensus and market price, and decide when Broadcom fits your investment strategy.
Do you think there's more to the story for Broadcom? Create your own Narrative to let the Community know!
This article by Simply Wall St is general in nature. We provide commentary based on historical data and analyst forecasts only using an unbiased methodology and our articles are not intended to be financial advice. It does not constitute a recommendation to buy or sell any stock, and does not take account of your objectives, or your financial situation. We aim to bring you long-term focused analysis driven by fundamental data. Note that our analysis may not factor in the latest price-sensitive company announcements or qualitative material. Simply Wall St has no position in any stocks mentioned.
Valuation is complex, but we're here to simplify it.
Discover if Broadcom might be undervalued or overvalued with our detailed analysis, featuring fair value estimates, potential risks, dividends, insider trades, and its financial condition.
Access Free AnalysisHave feedback on this article? Concerned about the content? Get in touch with us directly. Alternatively, email editorial-team@simplywallst.com
About NasdaqGS:AVGO
Broadcom
Designs, develops, and supplies various semiconductor devices and infrastructure software solutions worldwide.
Exceptional growth potential with outstanding track record.
Similar Companies
Market Insights

Advertisement
Community Narratives
Finding The True Value Of A Logistics Powerhouse
Fair Value US$95.21|8.4% undervalued
NV
Community Contributor
Paradigm Biopharmaceuticals Will Lead Osteoarthritis Treatment with Zilosul's FDA Success
Fair Value AU$5.50|92.1% undervalued
AM
Community Contributor
Barrick Mining (ABX:CA): A Gold Hedge against a U.S. Shutdown
Fair Value CA$60.00|24.2% undervalued
GM
Community Contributor