Advertisement
- United States
- /
- Specialty Stores
- /
- NYSE:TJX
Is There Still Upside for TJX After Its 16.7% Rally in 2025?

Simply Wall St
Reviewed by Bailey Pemberton
If you are holding shares of TJX Companies or thinking about getting involved, you probably know it has been quite the ride. After all, this isn't a name that sits still for long. In the short run, we’ve seen some back-and-forth, with the stock dipping 1.2% in the last week but putting up a modest 1.3% gain for the month. What really grabs attention, though, is the sustained strength. The stock is up 16.7% year-to-date, 24.8% over the past year, and has gained 128.4% and 160.8% over three and five years, respectively. Clearly, investors have seen reason to reward the stock, often tied to the company’s resilience in the face of shifting consumer spending and a retail environment that regulars say is anything but steady.
So why do some investors still wonder if TJX Companies is truly a bargain? That’s where valuation scores enter the picture. On a scale of 0 to 6, with 6 reflecting deep undervaluation, TJX Companies currently scores a 0. This means it doesn't come up as undervalued in any of the major checks. That might give pause to bargain hunters, but it also frames the big question: Is the market’s confidence in TJX deserved, or are we seeing signs of overenthusiasm?
Next, we’ll break down the standard approaches investors use to assess TJX’s valuation. Stick around, because we’ll reveal a smarter, more nuanced way to gauge value at the end of this article.
TJX Companies scores just 0/6 on our valuation checks. See what other red flags we found in the full valuation breakdown.
Approach 1: TJX Companies Discounted Cash Flow (DCF) Analysis
A Discounted Cash Flow (DCF) model estimates what a company is really worth by projecting its future free cash flows and then discounting those cash flows back to today's value. This approach is designed to cut through the stock market noise and focus on how much cash the business may generate in the years ahead.
For TJX Companies, current free cash flow stands at $4.05 Billion. Analysts provide detailed forecasts for the next five years, followed by extrapolations for the remainder of the decade. By 2030, projections have TJX reaching an annual free cash flow of $5.76 Billion, based on both analyst estimates and trend-based calculations. Notably, these extended forecasts, those beyond the five-year mark, are derived from Simply Wall St's own methodologies, layering in an extra dose of caution.
After discounting all those future cash flows to their present value, the DCF model delivers an intrinsic value estimate of $87.78 per share. However, compared to the current share price, this suggests TJX Companies is actually trading 61.0% above what the DCF model considers fair value. According to these calculations, the stock is overvalued at current levels.
Result: OVERVALUED
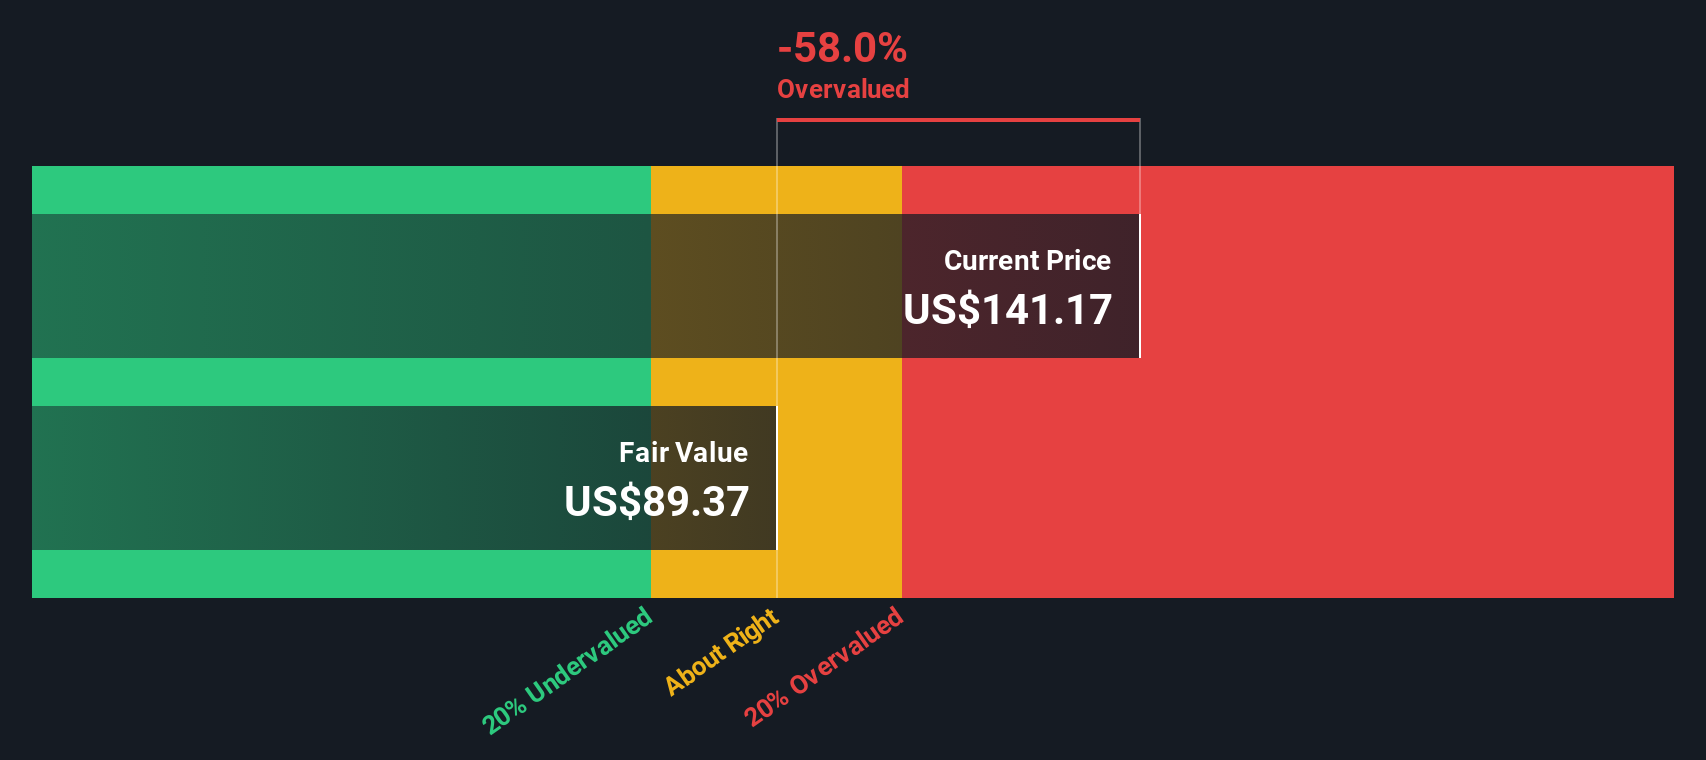
Our Discounted Cash Flow (DCF) analysis suggests TJX Companies may be overvalued by 61.0%. Find undervalued stocks or create your own screener to find better value opportunities.
Approach 2: TJX Companies Price vs Earnings
The Price-to-Earnings (PE) ratio is often the go-to metric for evaluating the valuation of established, profitable companies like TJX. This is because the PE ratio helps investors gauge how much the market is willing to pay for each dollar of earnings the company generates. As a result, it provides insight into market expectations around profitability.
However, there is no universally “right” PE ratio. Growth potential, profitability, risk profile, and industry dynamics all play a role in what is considered fair. Faster-growing or more resilient companies usually command higher PE multiples, while riskier firms or those with modest growth prospects are expected to trade at lower ones.
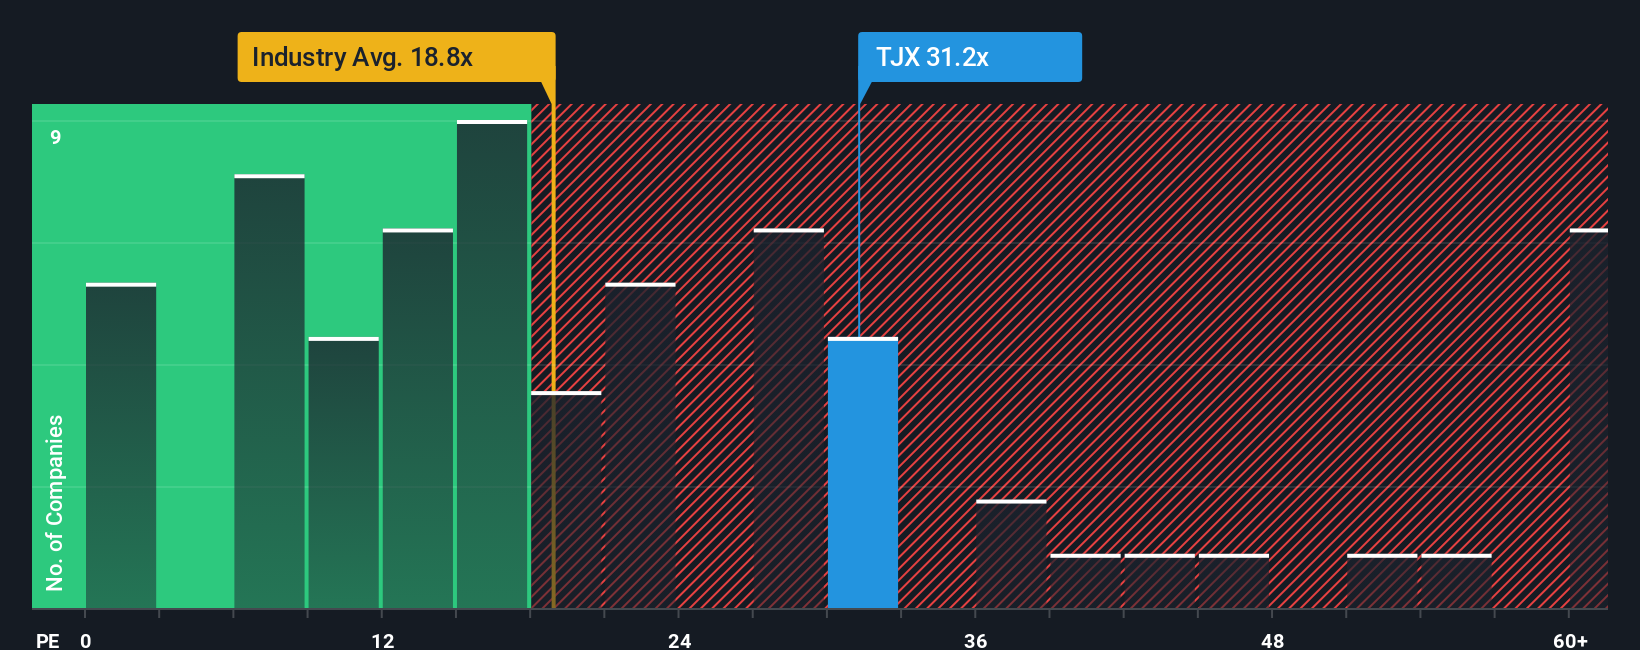
Currently, TJX Companies trades at a PE ratio of 31.62x. For context, this is significantly above the Specialty Retail industry average of 17.32x and above the average for its closest peers, which is 19.08x. At first glance, it appears expensive.
Instead of stopping the analysis there, it is important to consider the Simply Wall St “Fair Ratio.” This proprietary metric is designed to estimate what kind of multiple a company like TJX deserves by factoring in its earnings growth, margins, industry, company size, and unique risk factors. Rather than relying solely on industry or peer comparisons, the Fair Ratio offers investors a more tailored valuation benchmark.
For TJX, the Fair Ratio is calculated at 20.93x, which is well below the company’s current PE ratio. This gap suggests that the market is pricing in more optimism than the fundamentals support.
Result: OVERVALUED
PE ratios tell one story, but what if the real opportunity lies elsewhere? Discover companies where insiders are betting big on explosive growth.
Upgrade Your Decision Making: Choose your TJX Companies Narrative
Earlier, we mentioned that there's an even better way to understand valuation, so let's introduce you to Narratives. Rather than relying on a single number or traditional ratio, Narratives let you craft an investment story that connects your expectations for TJX Companies' future, such as revenue, margins, and earnings, to a specific fair value, all backed by your own assumptions. A Narrative essentially links what you believe is happening in the business to a financial forecast, making the investment case clear and actionable.
On Simply Wall St’s Community page, millions of investors use Narratives as an intuitive tool to apply their perspectives, compare with others, and update their view as new information such as earnings releases or news arrives. Narratives make it easy to understand when to buy, hold, or sell by directly showing where your Fair Value sits relative to today’s price.
For example, one investor’s Narrative for TJX Companies may highlight global expansion and improving margins, leading to a Fair Value of $164, while another focuses on margin pressures and digital competition, arriving at just $88. By seeing these dynamic scenarios side by side, you can decide which Narrative best fits your outlook, bringing more clarity and confidence to your investment decisions.
Do you think there's more to the story for TJX Companies? Create your own Narrative to let the Community know!
This article by Simply Wall St is general in nature. We provide commentary based on historical data and analyst forecasts only using an unbiased methodology and our articles are not intended to be financial advice. It does not constitute a recommendation to buy or sell any stock, and does not take account of your objectives, or your financial situation. We aim to bring you long-term focused analysis driven by fundamental data. Note that our analysis may not factor in the latest price-sensitive company announcements or qualitative material. Simply Wall St has no position in any stocks mentioned.
Valuation is complex, but we're here to simplify it.
Discover if TJX Companies might be undervalued or overvalued with our detailed analysis, featuring fair value estimates, potential risks, dividends, insider trades, and its financial condition.
Access Free AnalysisHave feedback on this article? Concerned about the content? Get in touch with us directly. Alternatively, email editorial-team@simplywallst.com
About NYSE:TJX
TJX Companies
Operates as an off-price apparel and home fashions retailer worldwide.
Flawless balance sheet with solid track record.
Similar Companies
Market Insights

Advertisement
Community Narratives
The Next Phase of Energy Storage: How NeoVolta Is Tackling America’s Power Crunch
Fair Value US$7.50|35.1% undervalued
MA
Community Contributor
Why EnSilica is Worth Possibly 13x its Current Price
Fair Value UK£5.00|89.8% undervalued
DO
Community Contributor
M&A Activity, Industry Diversification & A Defense Contract Monopoly Will Push BWXT For Healthy Long-Term Growth
Fair Value US$220.00|15.2% undervalued
CL
Community Contributor
A case for Cassiar Gold Corp (TSXV: GLDC) to reach CAD$8-10 before 2030 (X30-37)
Fair Value CA$10.00|96.0% undervalued
AG
Community Contributor