Advertisement
- United States
- /
- Food and Staples Retail
- /
- NYSE:TGT
Even After the Latest Rally, Target (NYSE:TGT) Remains Undervalued

After falling over 30% from the peak, Target Corporation (NYSE: TGT) is on a cusp of a turnaround.
While the positive earning results certainly play a part, reasonable valuation and uncertain geopolitical situation are drivers of interest for the stock.
Check out our latest analysis for Target
Q4 Earnings Results
- Non-GAAP EPS: US$3.19 (beat by US$0.34)
- Revenue: US$31b (miss by US$380m)
- Revenue growth: +9.4 Y/Y
Other highlights
- Q4 Comparable sales: +8.9%
- Q4 Digital sales: +9.2%
- Guidance growth FY 2022: low to mid-single-digit revenue growth and high single-digit growth for adjusted EPS
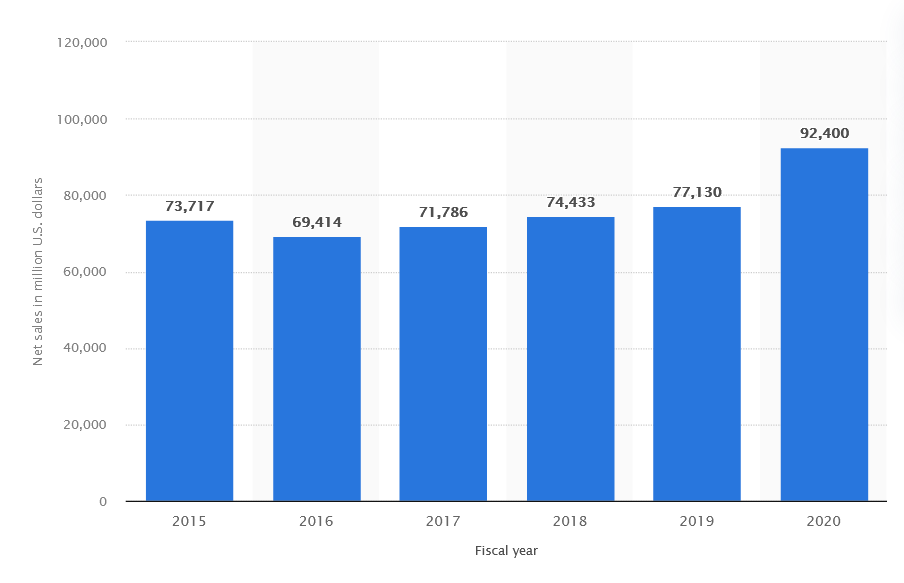
Looking back at the earnings from 2015-2020, you can compare how the growth accelerated over the beard as the current quarterly revenue stands at almost 50% of yearly revenues just a few years ago.
Meanwhile, the company announced a capital investment of up to US$5b to physical stores, digital experiences as well as boosting the supply chain capacity.
CEO Brian Cornell expects to see about 30 new stores ranging from mid-size suburban locations to small-format city center stores, as well as 200 complete renovations.
Estimating Target's Fair Value
Companies can be valued in many ways, so we would point out that a DCF is not perfect for every situation. If you still have some burning questions about this type of valuation, look at the Simply Wall St analysis model.
We will use a DCF model, which considers two stages of growth. The first stage is generally a higher growth period which levels off heading towards the terminal value, captured in the second "steady growth" period. First, we need to estimate the next ten years of cash flows. Where possible, we use analyst estimates, but when these aren't available, we extrapolate the previous free cash flow (FCF) from the last estimate or reported value.
Generally, we assume that a dollar today is more valuable than a dollar in the future, so we discount the value of these future cash flows to their estimated value in today's dollars:
10-year free cash flow (FCF) estimate
| 2022 | 2023 | 2024 | 2025 | 2026 | 2027 | 2028 | 2029 | 2030 | 2031 | |
| Levered FCF ($, Millions) | US$5.46b | US$4.62b | US$5.42b | US$6.41b | US$6.80b | US$7.26b | US$7.61b | US$7.91b | US$8.17b | US$8.41b |
| Growth Rate Estimate Source | Analyst x7 | Analyst x7 | Analyst x6 | Analyst x3 | Analyst x3 | Analyst x2 | Est @ 4.78% | Est @ 3.92% | Est @ 3.32% | Est @ 2.9% |
| Present Value ($, Millions) Discounted @ 5.8% | US$5.2k | US$4.1k | US$4.6k | US$5.1k | US$5.1k | US$5.2k | US$5.1k | US$5.0k | US$4.9k | US$4.8k |
("Est" = FCF growth rate estimated by Simply Wall St)
Present Value of 10-year Cash Flow (PVCF) = US$49b
We need to calculate the Terminal Value, which accounts for all the future cash flows after this ten-year period. For many reasons, a very conservative growth rate is used that cannot exceed that of a country's GDP growth. In this case, we have used the 5-year average of the 10-year government bond yield (1.9%) to estimate future growth.
In the same way, as with the 10-year "growth" period, we discount future cash flows to today's value, using a cost of equity of 5.8%.
Terminal Value (TV)= FCF2031 × (1 + g) ÷ (r – g) = US$8.4b× (1 + 1.9%) ÷ (5.8%– 1.9%) = US$222b
Present Value of Terminal Value (PVTV)= TV / (1 + r)10= US$222b÷ ( 1 + 5.8%)10= US$126b
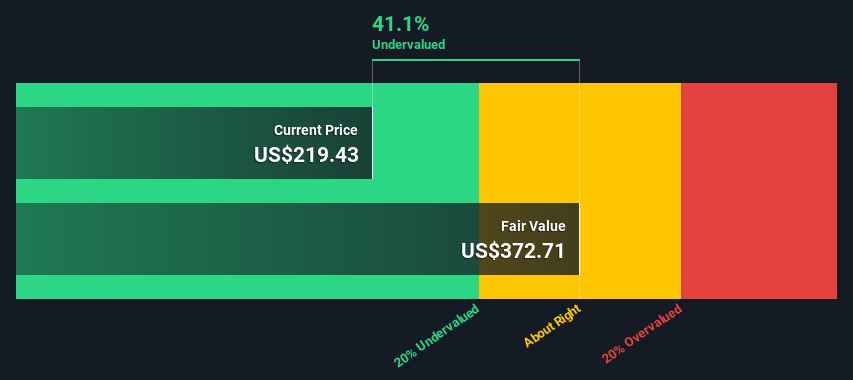
The total value, or equity value, is then the sum of the present value of the future cash flows, which in this case is US$176b. The last step is to divide the equity value by the number of shares outstanding. Relative to the current share price of US$219, the company appears quite good value at a 41% discount to where the stock price trades currently. Remember, though, that this is just an approximate valuation.
Important assumptions
The most critical inputs to a discounted cash flow are the discount rate and, of course, the actual cash flows. Part of investing is coming up with your evaluation of a company's future performance, so try the calculation yourself and check your assumptions. The DCF also does not consider the possible cyclicality of an industry or a company's future capital requirements, so it does not give a complete picture of its potential performance.
Given that we are looking at Target as potential shareholders, the cost of equity is used as the discount rate rather than the cost of capital (or the weighted average cost of capital, WACC), which accounts for debt. We've used 5.8% in this calculation, which is based on a levered beta of 0.911. Beta is a measure of a stock's volatility compared to the market as a whole.
Moving On:
While the DCF model is not a perfect stock valuation, Target does look undervalued. As far as history tells us, its 10-year average P/E ratio is 16.5. thus at 14.7, it is historically undervalued at the moment. Meanwhile, the company has been slowly reducing its debt over the past 5 years and boasts a dividend with a relatively low payout ratio. This ratio means that they can significantly increase the dividends if they see fit.
Overall, Target seems to be a better value bet than its competitors at the moment, but we have compiled a checklist you might explore to clarify the situation further:
- Risks: Case in point, we've spotted 1 warning sign for Target you should be aware of.
- Future Earnings: How does TGT's growth rate compare to its peers and the broader market? Dig deeper into the analyst consensus number for the upcoming years by interacting with our free analyst growth expectation chart.
- Other Solid Businesses: Low debt, high returns on equity, and good past performance are fundamental to a strong business. Why not explore our interactive list of stocks with solid business fundamentals to see if there are other companies you may not have considered!
PS. The Simply Wall St app conducts a discounted cash flow valuation for every stock on the NYSE every day. If you want to find the calculation for other stocks, just search here.
Valuation is complex, but we're here to simplify it.
Discover if Target might be undervalued or overvalued with our detailed analysis, featuring fair value estimates, potential risks, dividends, insider trades, and its financial condition.
Access Free AnalysisHave feedback on this article? Concerned about the content? Get in touch with us directly. Alternatively, email editorial-team@simplywallst.com
Simply Wall St analyst Stjepan Kalinic and Simply Wall St have no position in any of the companies mentioned. This article is general in nature. We provide commentary based on historical data and analyst forecasts only using an unbiased methodology and our articles are not intended to be financial advice. It does not constitute a recommendation to buy or sell any stock and does not take account of your objectives, or your financial situation. We aim to bring you long-term focused analysis driven by fundamental data. Note that our analysis may not factor in the latest price-sensitive company announcements or qualitative material.

Stjepan Kalinic
Stjepan is a writer and an analyst covering equity markets. As a former multi-asset analyst, he prefers to look beyond the surface and uncover ideas that might not be on retail investors' radar. You can find his research all over the internet, including Simply Wall St News, Yahoo Finance, Benzinga, Vincent, and Barron's.
About NYSE:TGT
Undervalued established dividend payer.
Similar Companies
Market Insights

Advertisement
Community Narratives
Groundbreaking therapies that could change the treatment landscape for PTSD, fibromyalgia, MS & Alzheimer’s
Fair Value US$6.20|86.9% undervalued
CM
Community Contributor
DigitalOcean Will Grow 14% by Embracing AI with Paperspace Acquisition
Fair Value US$50.00|41.7% undervalued
NE
Community Contributor
Viant Technology: A Rising AdTech Challenger in the AI-Powered CTV Market
Fair Value US$38.61|63.2% undervalued
BL
Community Contributor
Volvo will Accelerate Forward into Electric and Autonomous Leadership in Five Years
Fair Value SEK 438.80|39.7% undervalued
UN
Community Contributor