- United States
- /
- Specialty Stores
- /
- NYSE:SBH
Despite lower earnings than a year ago, Sally Beauty Holdings (NYSE:SBH) investors are up 74% since then


Passive investing in index funds can generate returns that roughly match the overall market. But one can do better than that by picking better than average stocks (as part of a diversified portfolio). For example, the Sally Beauty Holdings, Inc. (NYSE:SBH) share price is up 74% in the last 1 year, clearly besting the market return of around 34% (not including dividends). If it can keep that out-performance up over the long term, investors will do very well! In contrast, the longer term returns are negative, since the share price is 21% lower than it was three years ago.
Since the long term performance has been good but there's been a recent pullback of 7.0%, let's check if the fundamentals match the share price.
View our latest analysis for Sally Beauty Holdings
There is no denying that markets are sometimes efficient, but prices do not always reflect underlying business performance. One way to examine how market sentiment has changed over time is to look at the interaction between a company's share price and its earnings per share (EPS).
Over the last twelve months, Sally Beauty Holdings actually shrank its EPS by 7.6%.
Given the share price gain, we doubt the market is measuring progress with EPS. Indeed, when EPS is declining but the share price is up, it often means the market is considering other factors.
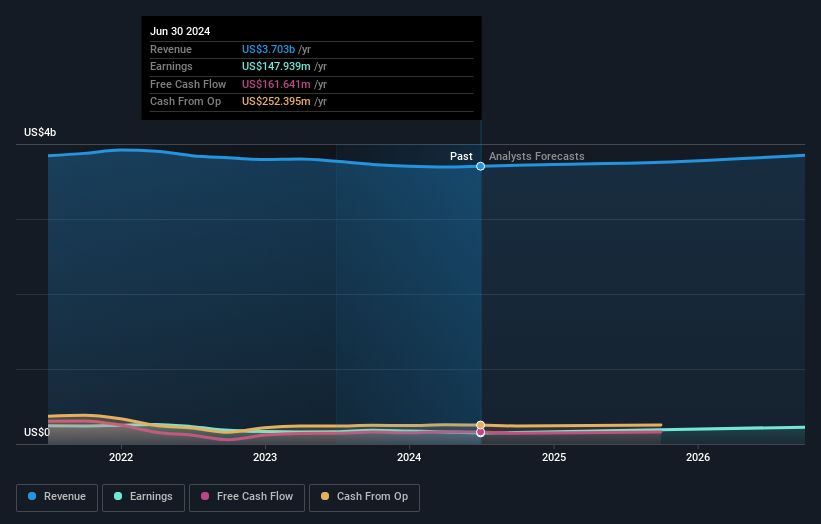
Revenue was pretty flat year on year, but maybe a closer look at the data can explain the market optimism.
You can see how earnings and revenue have changed over time in the image below (click on the chart to see the exact values).
If you are thinking of buying or selling Sally Beauty Holdings stock, you should check out this FREE detailed report on its balance sheet.
A Different Perspective
We're pleased to report that Sally Beauty Holdings shareholders have received a total shareholder return of 74% over one year. That certainly beats the loss of about 3% per year over the last half decade. The long term loss makes us cautious, but the short term TSR gain certainly hints at a brighter future. It's always interesting to track share price performance over the longer term. But to understand Sally Beauty Holdings better, we need to consider many other factors. To that end, you should be aware of the 1 warning sign we've spotted with Sally Beauty Holdings .
If you would prefer to check out another company -- one with potentially superior financials -- then do not miss this free list of companies that have proven they can grow earnings.
Please note, the market returns quoted in this article reflect the market weighted average returns of stocks that currently trade on American exchanges.
New: Manage All Your Stock Portfolios in One Place
We've created the ultimate portfolio companion for stock investors, and it's free.
• Connect an unlimited number of Portfolios and see your total in one currency
• Be alerted to new Warning Signs or Risks via email or mobile
• Track the Fair Value of your stocks
Have feedback on this article? Concerned about the content? Get in touch with us directly. Alternatively, email editorial-team (at) simplywallst.com.
This article by Simply Wall St is general in nature. We provide commentary based on historical data and analyst forecasts only using an unbiased methodology and our articles are not intended to be financial advice. It does not constitute a recommendation to buy or sell any stock, and does not take account of your objectives, or your financial situation. We aim to bring you long-term focused analysis driven by fundamental data. Note that our analysis may not factor in the latest price-sensitive company announcements or qualitative material. Simply Wall St has no position in any stocks mentioned.
About NYSE:SBH
Sally Beauty Holdings
Operates as a specialty retailer and distributor of professional beauty supplies.
Very undervalued with adequate balance sheet.

