Advertisement
- United States
- /
- Specialty Stores
- /
- NYSE:PAG
Does Penske Automotive Group Offer Value After Recent Dealership Acquisitions?

Simply Wall St
Reviewed by Bailey Pemberton
- Wondering if Penske Automotive Group is a hidden gem at its current share price? If you are looking for value in the stock market, PAG might be on your radar right now.
- The stock closed at $160.63, with modest moves recently: up 1.0% over the last week, but essentially flat over the past year after a strong run earlier (211.2% over five years).
- Fresh headlines around major dealership acquisitions and expanding international operations have been catching investor attention this year. These developments are helping to shape market sentiment, stirring up both excitement and questions about what is next for the company.
- Penske earns a 4 out of 6 on our valuation scorecard, suggesting real potential. However, there is more to the story. Next, we’ll break down what those valuation checks actually mean and reveal a smarter way to assess if PAG is truly undervalued.
Approach 1: Penske Automotive Group Discounted Cash Flow (DCF) Analysis
A Discounted Cash Flow (DCF) valuation model estimates a company's worth by projecting its future free cash flows and then discounting those sums back to today's dollars. This method helps investors understand what the business could be worth based on the money it is expected to generate over time.
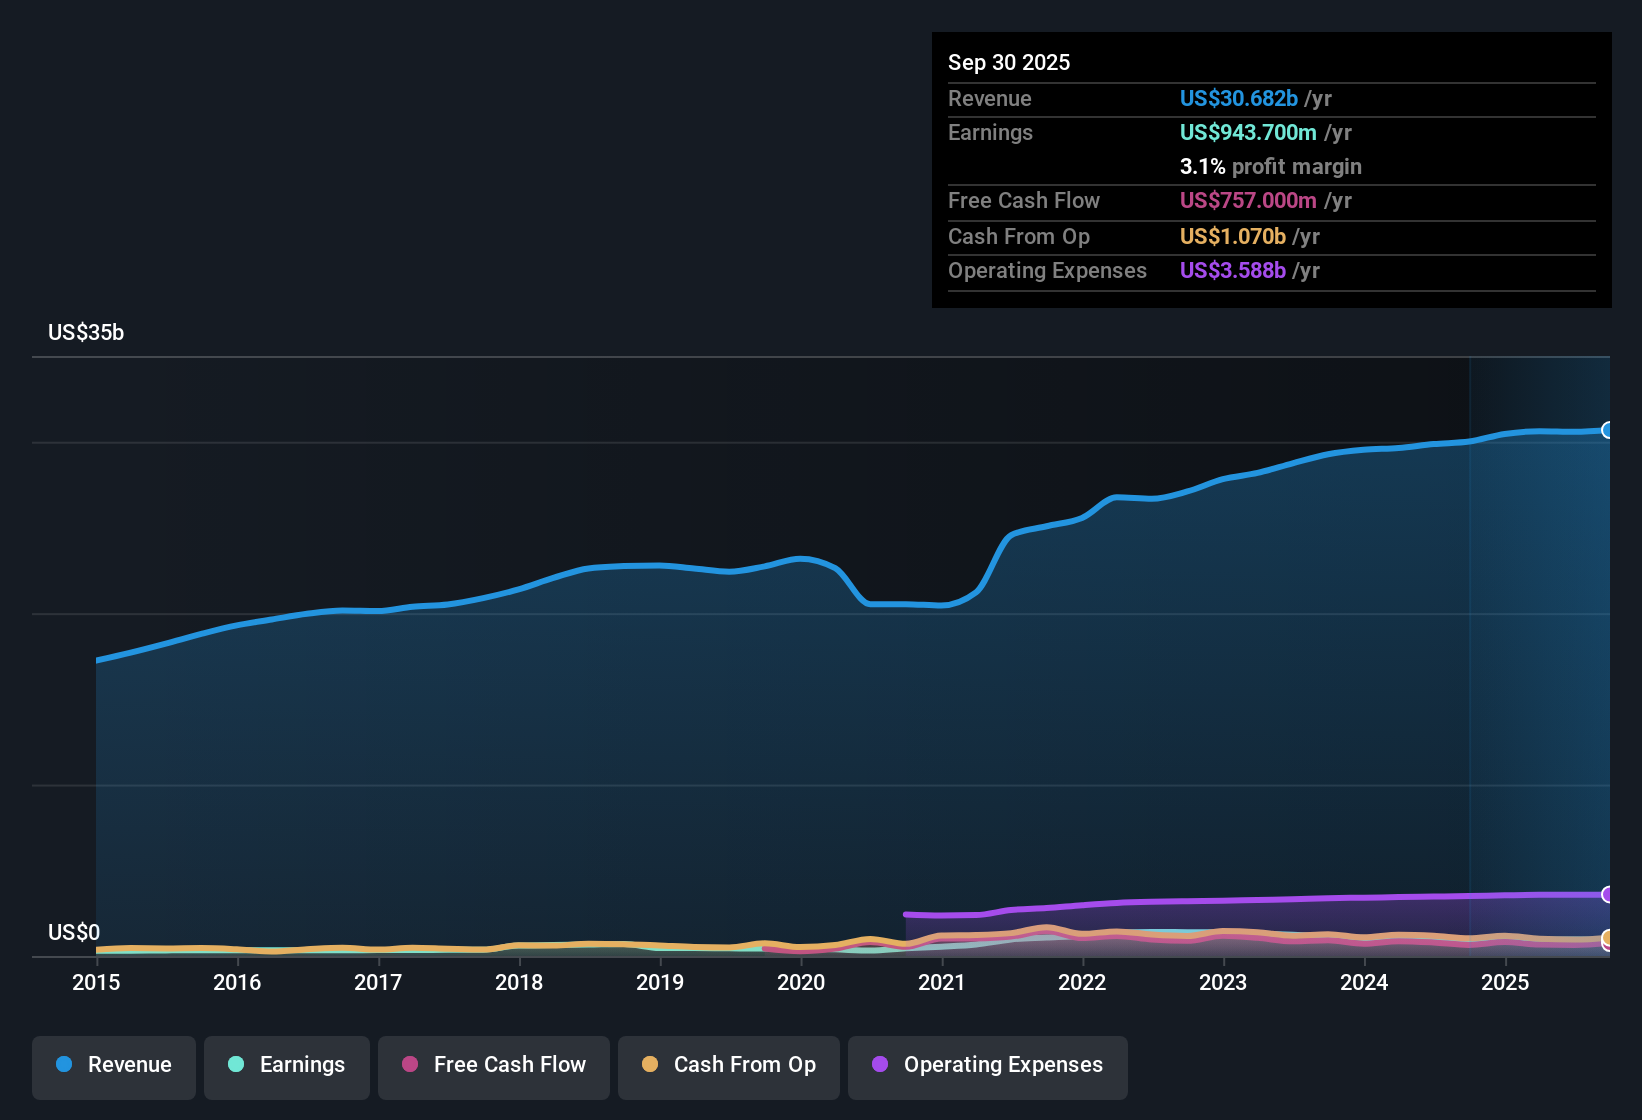
For Penske Automotive Group, the current Free Cash Flow (FCF) stands at $708.98 million. Analyst estimates take the company's FCF up to $858 million by 2027. Beyond that, projections are extrapolated by Simply Wall St, with a figure reaching approximately $1.03 billion by 2035. These forecasts factor in gradual annual growth in FCF. All cash flows referenced are in US dollars, matching the share price currency.
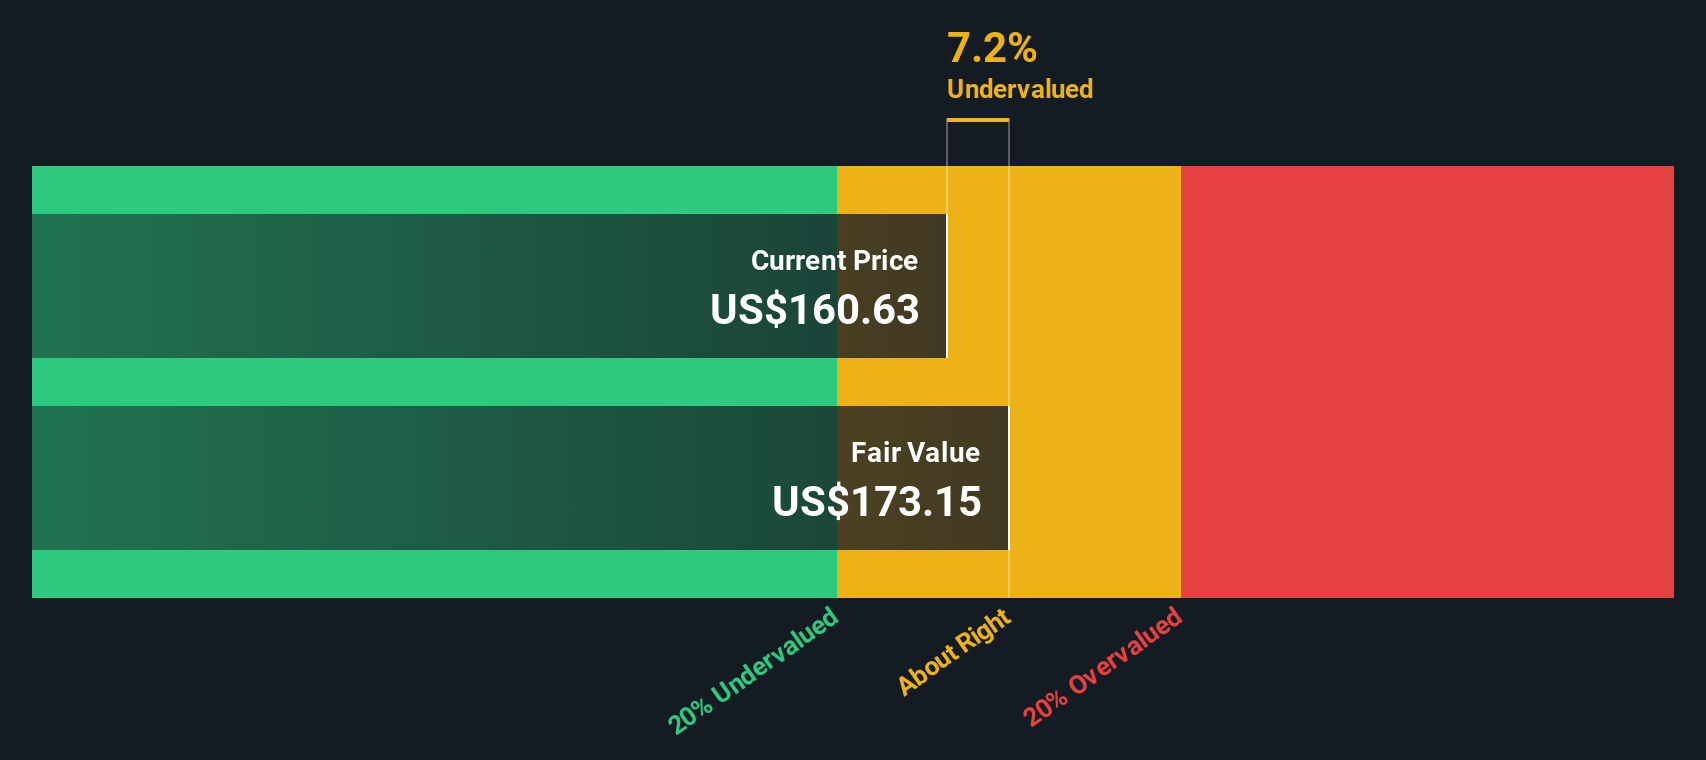
The DCF model arrives at an estimated intrinsic value of $173.15 per share compared to the latest share price of $160.63. This suggests Penske Automotive Group trades at a 7.2% discount to its DCF-implied value, meaning the stock is valued very close to its intrinsic worth based on these cash flow assumptions.
Result: ABOUT RIGHT
Penske Automotive Group is fairly valued according to our Discounted Cash Flow (DCF), but this can change at a moment's notice. Track the value in your watchlist or portfolio and be alerted on when to act.
Approach 2: Penske Automotive Group Price vs Earnings
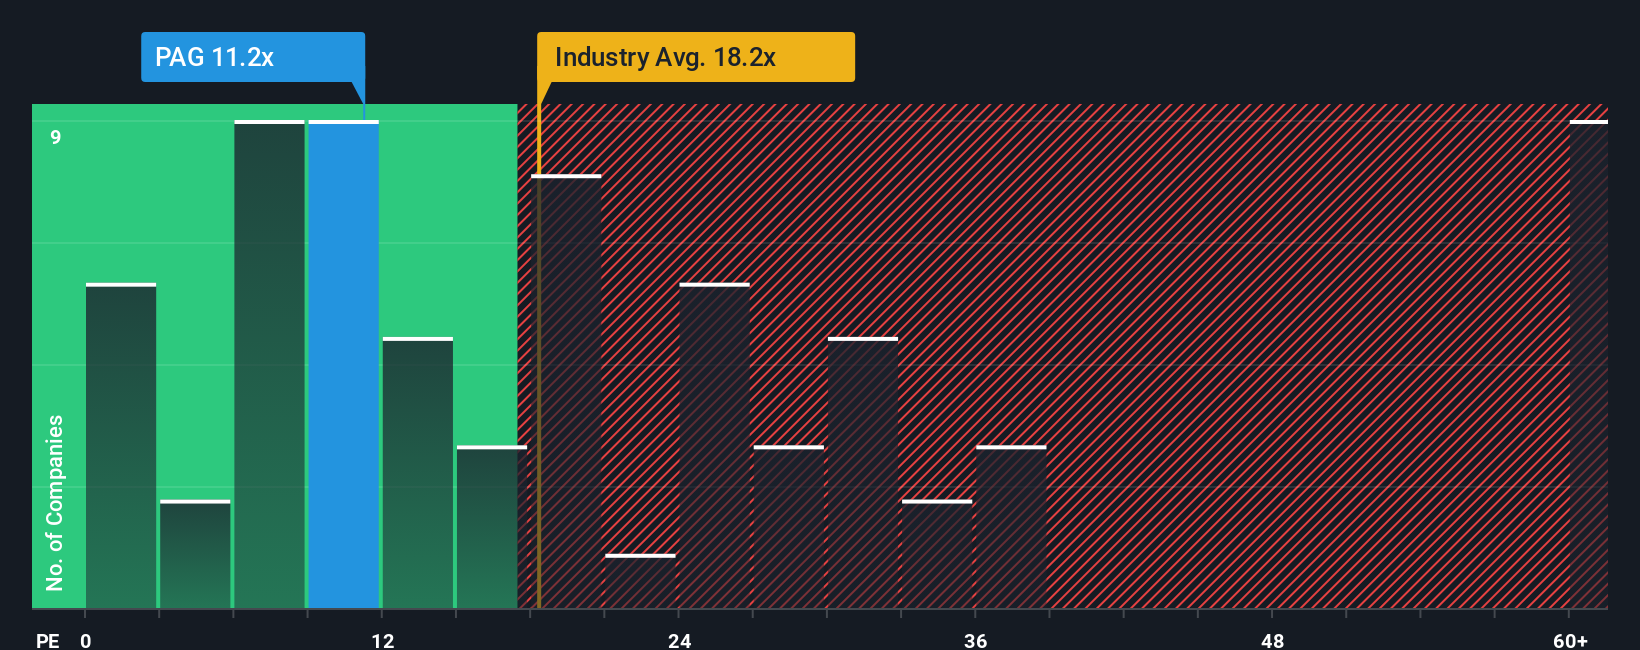
For established and profitable companies like Penske Automotive Group, the Price-to-Earnings (PE) ratio is a widely used tool. It provides a straightforward way to gauge how much investors are willing to pay for every dollar of earnings, which makes it ideal for companies with consistent profits.
The level at which a PE ratio is considered “normal” or “fair” depends on expectations of future earnings growth and perceived risks. Generally, companies anticipated to grow faster or with less risk warrant a higher PE, while those with slower growth or higher risk trade at lower multiples.
Penske currently trades at a PE of 11.2x. This is below both the industry average of 18.2x and the peer average of 12.0x in the Specialty Retail sector. This suggests the market assigns a lower value to the company’s current earnings than its peers.
To get a more precise picture, Simply Wall St calculates a Fair Ratio for Penske, which in this case is 14.4x. This proprietary metric accounts for Penske’s specific growth prospects, profitability, industry characteristics, and market cap, providing a tailored benchmark rather than a simple average. By weighing these factors holistically, the Fair Ratio offers a smarter comparison point than broad industry or peer averages.
Comparing Penske’s current PE of 11.2x to its Fair Ratio of 14.4x indicates that the stock is attractively valued given its fundamentals.
Result: UNDERVALUED
PE ratios tell one story, but what if the real opportunity lies elsewhere? Discover 1430 companies where insiders are betting big on explosive growth.
Upgrade Your Decision Making: Choose your Penske Automotive Group Narrative
Earlier, we mentioned that there is an even better way to understand valuation, so let's introduce you to Narratives. A Narrative is simply the story you believe about a company’s future, based on your view of its strategy, strengths, risks, and the numbers that support them, such as expected revenue, margins, and fair value. By linking a company’s story to a financial forecast and, ultimately, a fair value, Narratives bridge the gap between raw data and real-world events. This gives investors clarity around what matters most for their decisions.
Simply Wall St’s Narratives are an easy, accessible tool available on the Community page and are used by millions of investors worldwide. They make investing smarter by letting you follow different Narratives, compare Fair Value to the current Price, and help you decide whether to buy or sell, all based on the story you believe. Best of all, Narratives update automatically as news or earnings reports come in, so your investing outlook stays current without manual effort.
For Penske Automotive Group, for example, some investors see steady growth as aging vehicle fleets and digital advances boost service profits, giving targets as high as $200 per share. Others note challenges such as regulatory shifts to electric vehicles and industry disruption, leading to more cautious targets near $155. Narratives let you choose which forecast best matches your own perspective, making your investment decisions more confident and personalized.
Do you think there's more to the story for Penske Automotive Group? Head over to our Community to see what others are saying!
This article by Simply Wall St is general in nature. We provide commentary based on historical data and analyst forecasts only using an unbiased methodology and our articles are not intended to be financial advice. It does not constitute a recommendation to buy or sell any stock, and does not take account of your objectives, or your financial situation. We aim to bring you long-term focused analysis driven by fundamental data. Note that our analysis may not factor in the latest price-sensitive company announcements or qualitative material. Simply Wall St has no position in any stocks mentioned.
New: Manage All Your Stock Portfolios in One Place
We've created the ultimate portfolio companion for stock investors, and it's free.
• Connect an unlimited number of Portfolios and see your total in one currency
• Be alerted to new Warning Signs or Risks via email or mobile
• Track the Fair Value of your stocks
Have feedback on this article? Concerned about the content? Get in touch with us directly. Alternatively, email editorial-team@simplywallst.com
About NYSE:PAG
Penske Automotive Group
A diversified transportation services company, operates automotive and commercial truck dealerships worldwide.
Solid track record, good value and pays a dividend.
Similar Companies
Market Insights

Advertisement
Community Narratives
MicroVision will explode future revenue by 380.37% with a vision towards success
Fair Value US$60.00|98.4% undervalued
TH
Community Contributor
The Indispensable Artery for a New North American Economy
Fair Value CA$132.87|1.3% undervalued
TI
Community Contributor