
Advertisement
- United States
- /
- Specialty Stores
- /
- NYSE:GROV
Grove Collaborative Holdings, Inc.'s (NYSE:GROV) 28% Share Price Surge Not Quite Adding Up
The Grove Collaborative Holdings, Inc. (NYSE:GROV) share price has done very well over the last month, posting an excellent gain of 28%. But the gains over the last month weren't enough to make shareholders whole, as the share price is still down 5.1% in the last twelve months.
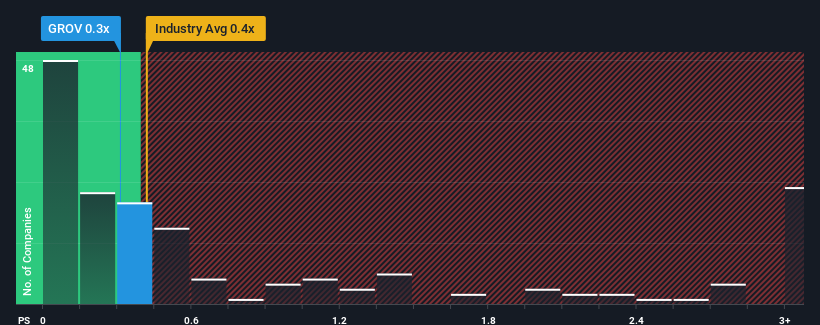
Even after such a large jump in price, you could still be forgiven for feeling indifferent about Grove Collaborative Holdings' P/S ratio of 0.3x, since the median price-to-sales (or "P/S") ratio for the Specialty Retail industry in the United States is also close to 0.4x. However, investors might be overlooking a clear opportunity or potential setback if there is no rational basis for the P/S.
See our latest analysis for Grove Collaborative Holdings
What Does Grove Collaborative Holdings' P/S Mean For Shareholders?
Grove Collaborative Holdings hasn't been tracking well recently as its declining revenue compares poorly to other companies, which have seen some growth in their revenues on average. Perhaps the market is expecting its poor revenue performance to improve, keeping the P/S from dropping. You'd really hope so, otherwise you're paying a relatively elevated price for a company with this sort of growth profile.
Want the full picture on analyst estimates for the company? Then our free report on Grove Collaborative Holdings will help you uncover what's on the horizon.What Are Revenue Growth Metrics Telling Us About The P/S?
There's an inherent assumption that a company should be matching the industry for P/S ratios like Grove Collaborative Holdings' to be considered reasonable.
Taking a look back first, the company's revenue growth last year wasn't something to get excited about as it posted a disappointing decline of 22%. As a result, revenue from three years ago have also fallen 45% overall. Accordingly, shareholders would have felt downbeat about the medium-term rates of revenue growth.
Turning to the outlook, the next year should bring diminished returns, with revenue decreasing 4.6% as estimated by the dual analysts watching the company. That's not great when the rest of the industry is expected to grow by 4.4%.
With this information, we find it concerning that Grove Collaborative Holdings is trading at a fairly similar P/S compared to the industry. It seems most investors are hoping for a turnaround in the company's business prospects, but the analyst cohort is not so confident this will happen. There's a good chance these shareholders are setting themselves up for future disappointment if the P/S falls to levels more in line with the negative growth outlook.
What Does Grove Collaborative Holdings' P/S Mean For Investors?
Grove Collaborative Holdings' stock has a lot of momentum behind it lately, which has brought its P/S level with the rest of the industry. While the price-to-sales ratio shouldn't be the defining factor in whether you buy a stock or not, it's quite a capable barometer of revenue expectations.
It appears that Grove Collaborative Holdings currently trades on a higher than expected P/S for a company whose revenues are forecast to decline. When we see a gloomy outlook like this, our immediate thoughts are that the share price is at risk of declining, negatively impacting P/S. If the declining revenues were to materialize in the form of a declining share price, shareholders will be feeling the pinch.
Don't forget that there may be other risks. For instance, we've identified 3 warning signs for Grove Collaborative Holdings that you should be aware of.
Of course, profitable companies with a history of great earnings growth are generally safer bets. So you may wish to see this free collection of other companies that have reasonable P/E ratios and have grown earnings strongly.
New: Manage All Your Stock Portfolios in One Place
We've created the ultimate portfolio companion for stock investors, and it's free.
• Connect an unlimited number of Portfolios and see your total in one currency
• Be alerted to new Warning Signs or Risks via email or mobile
• Track the Fair Value of your stocks
Have feedback on this article? Concerned about the content? Get in touch with us directly. Alternatively, email editorial-team (at) simplywallst.com.
This article by Simply Wall St is general in nature. We provide commentary based on historical data and analyst forecasts only using an unbiased methodology and our articles are not intended to be financial advice. It does not constitute a recommendation to buy or sell any stock, and does not take account of your objectives, or your financial situation. We aim to bring you long-term focused analysis driven by fundamental data. Note that our analysis may not factor in the latest price-sensitive company announcements or qualitative material. Simply Wall St has no position in any stocks mentioned.
About NYSE:GROV
Grove Collaborative Holdings
A consumer products company, develops and sells household, personal care, beauty, and other consumer products in the United States.
Adequate balance sheet with low risk.
Similar Companies
Market Insights

Advertisement
Community Narratives
Kodiak AI - a potential 100 bagger opportunity?
Fair Value US$14.00|44.7% undervalued
DA
Community Contributor
A Fair Price for a Great Business Facing Real Threats
Fair Value US$383.06|13.0% undervalued
IM
Community Contributor
AXON And Shopify Integration Will Unlock Global Mobile Advertising
Fair Value US$646.30|0% overvalued
AN
Based on Analyst Price Targets