Best Buy (BBY) shares have seen steady gains over the past month, climbing more than 12%. The stock’s move stands out as investors sort through recent performance data and look for signs of a shift in the retail landscape.
Best Buy’s recent gains have given investors something to talk about, with the latest 30-day share price return of nearly 13% turning heads after a rocky start to the year. However, momentum is still building from the lows, as shown by a solid 22% move over the past three months. The longer-term story includes a 1-year total shareholder return of -8% and a strong 3-year total return of 44%.
With recent momentum driving Best Buy’s shares upward, the key question becomes whether its current price still represents value or if today’s market optimism already accounts for the company’s future growth potential. Is there a real buying window here, or has the run-up priced in what lies ahead?
Advertisement
Most Popular Narrative: 3% Overvalued
Best Buy’s prevailing narrative price target sits slightly above the most recent close, suggesting that the market’s optimism may have edged ahead of analysts’ consensus fair value. For now, enthusiasm is running just a notch higher than the evidence from expected earnings and revenue growth.
The analysts have a consensus price target of $79.762 for Best Buy based on their expectations of its future earnings growth, profit margins and other risk factors. However, there is a degree of disagreement amongst analysts, with the most bullish reporting a price target of $95.0, and the most bearish reporting a price target of just $60.0.
Why are analysts reluctant to push targets much higher despite optimistic growth projections? The narrative’s assumptions for profit margins, future buybacks, and a new profit multiple might surprise you. Find out what is driving the calculation and how it compares to today’s market buzz.
However, persistent cost pressures and intensified online competition could limit profitability. This may make it harder for Best Buy to maintain recent momentum.
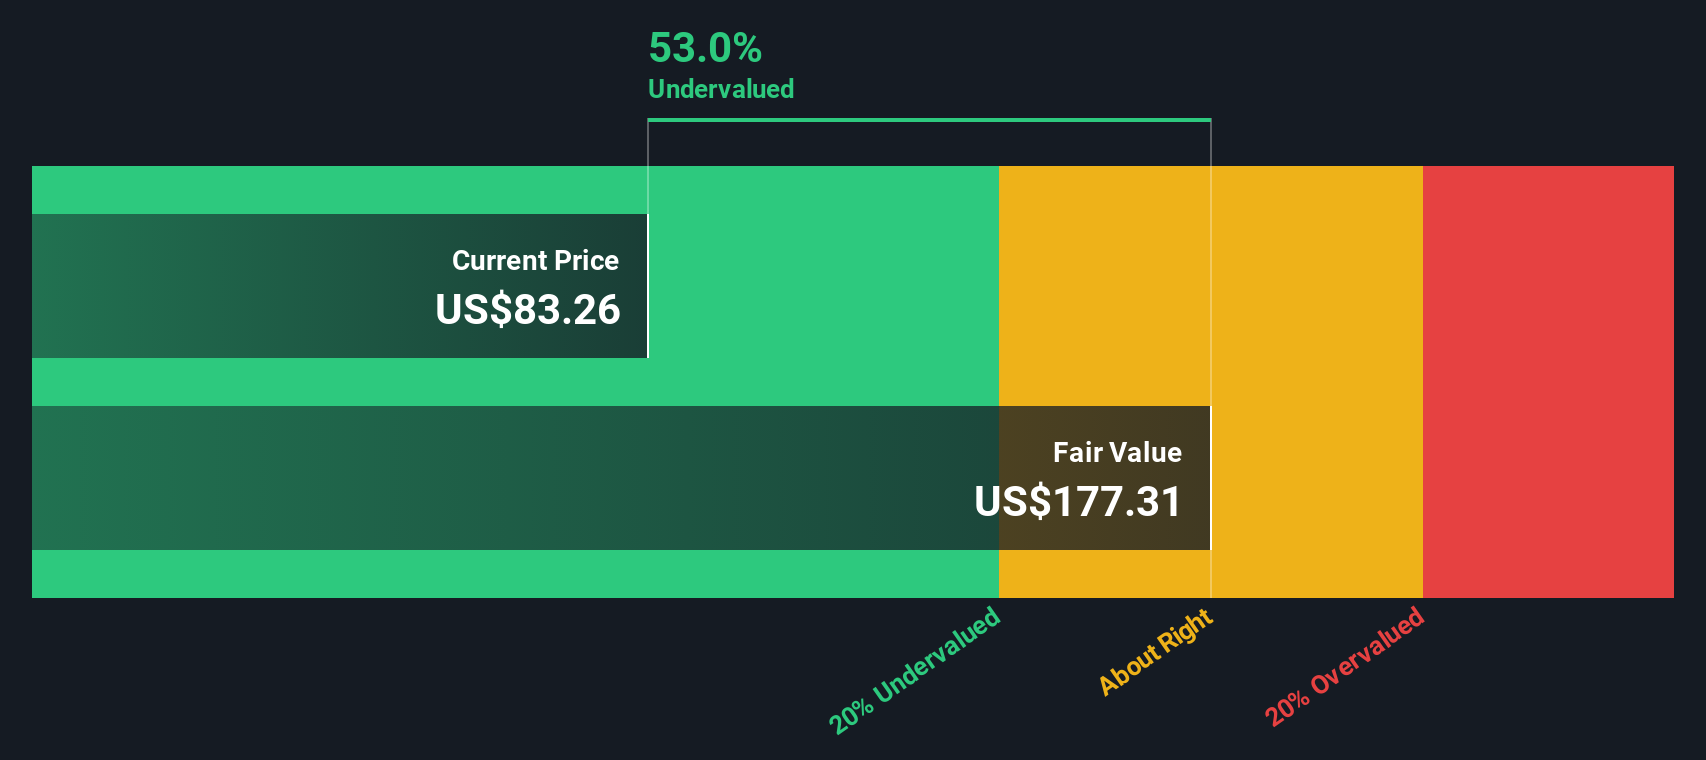
While the market’s current valuation suggests Best Buy might be slightly overvalued compared to analyst targets, our DCF model takes a different perspective. Factoring in long-term cash flows, the SWS DCF model estimates Best Buy’s fair value at $170.13, a level far above today’s share price. Could the market be missing something deeper about Best Buy’s future?
Simply Wall St performs a discounted cash flow (DCF) on every stock in the world every day (check out Best Buy for example). We show the entire calculation in full. You can track the result in your watchlist or portfolio and be alerted when this changes, or use our stock screener to discover undervalued stocks based on their cash flows. If you save a screener we even alert you when new companies match - so you never miss a potential opportunity.
Build Your Own Best Buy Narrative
If you see things differently or want to dig into the numbers yourself, you can build your own narrative in just a few minutes, your way with Do it your way.
Join innovators who are transforming healthcare by checking out these 33 healthcare AI stocks pushing the boundaries of medical technology.
Lead the charge into tomorrow’s powerful technology by focusing on these 27 quantum computing stocks at the forefront of computation breakthroughs.
This article by Simply Wall St is general in nature. We provide commentary based on historical data
and analyst forecasts only using an unbiased methodology and our articles are not intended to be financial advice. It does not constitute a recommendation to buy or sell any stock, and does not take account of your objectives, or your
financial situation. We aim to bring you long-term focused analysis driven by fundamental data.
Note that our analysis may not factor in the latest price-sensitive company announcements or qualitative material.
Simply Wall St has no position in any stocks mentioned.
Valuation is complex, but we're here to simplify it.
Discover if Best Buy might be undervalued or overvalued with our detailed analysis, featuring fair value estimates, potential risks, dividends, insider trades, and its financial condition.