- United States
- /
- Specialty Stores
- /
- NasdaqGM:WINA
Winmark (NASDAQ:WINA) stock performs better than its underlying earnings growth over last five years


The most you can lose on any stock (assuming you don't use leverage) is 100% of your money. But when you pick a company that is really flourishing, you can make more than 100%. One great example is Winmark Corporation (NASDAQ:WINA) which saw its share price drive 136% higher over five years. It's also up 13% in about a month.
The past week has proven to be lucrative for Winmark investors, so let's see if fundamentals drove the company's five-year performance.
View our latest analysis for Winmark
There is no denying that markets are sometimes efficient, but prices do not always reflect underlying business performance. One imperfect but simple way to consider how the market perception of a company has shifted is to compare the change in the earnings per share (EPS) with the share price movement.
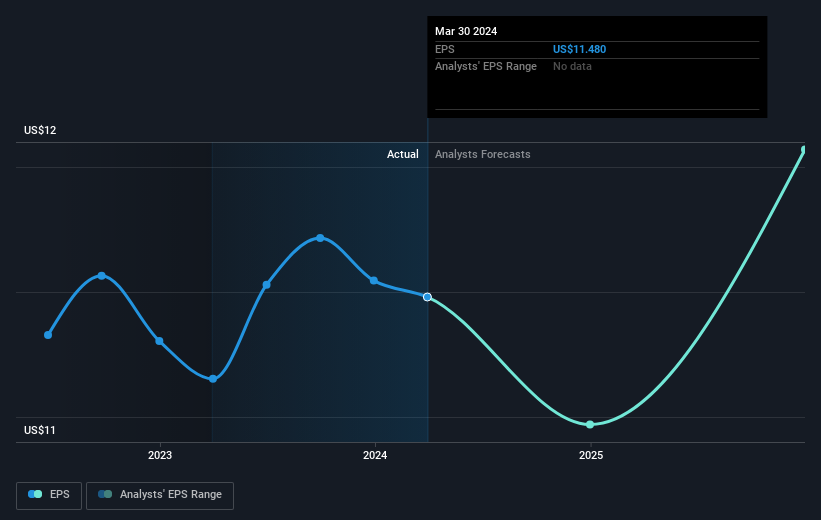
During five years of share price growth, Winmark achieved compound earnings per share (EPS) growth of 7.9% per year. This EPS growth is lower than the 19% average annual increase in the share price. This suggests that market participants hold the company in higher regard, these days. That's not necessarily surprising considering the five-year track record of earnings growth.
You can see how EPS has changed over time in the image below (click on the chart to see the exact values).
It's probably worth noting that the CEO is paid less than the median at similar sized companies. It's always worth keeping an eye on CEO pay, but a more important question is whether the company will grow earnings throughout the years. Before buying or selling a stock, we always recommend a close examination of historic growth trends, available here..
What About Dividends?
As well as measuring the share price return, investors should also consider the total shareholder return (TSR). Whereas the share price return only reflects the change in the share price, the TSR includes the value of dividends (assuming they were reinvested) and the benefit of any discounted capital raising or spin-off. Arguably, the TSR gives a more comprehensive picture of the return generated by a stock. We note that for Winmark the TSR over the last 5 years was 166%, which is better than the share price return mentioned above. And there's no prize for guessing that the dividend payments largely explain the divergence!
A Different Perspective
Winmark shareholders gained a total return of 17% during the year. Unfortunately this falls short of the market return. If we look back over five years, the returns are even better, coming in at 22% per year for five years. It may well be that this is a business worth popping on the watching, given the continuing positive reception, over time, from the market. It's always interesting to track share price performance over the longer term. But to understand Winmark better, we need to consider many other factors. To that end, you should learn about the 3 warning signs we've spotted with Winmark (including 1 which makes us a bit uncomfortable) .
But note: Winmark may not be the best stock to buy. So take a peek at this free list of interesting companies with past earnings growth (and further growth forecast).
Please note, the market returns quoted in this article reflect the market weighted average returns of stocks that currently trade on American exchanges.
Valuation is complex, but we're here to simplify it.
Discover if Winmark might be undervalued or overvalued with our detailed analysis, featuring fair value estimates, potential risks, dividends, insider trades, and its financial condition.
Access Free AnalysisHave feedback on this article? Concerned about the content? Get in touch with us directly. Alternatively, email editorial-team (at) simplywallst.com.
This article by Simply Wall St is general in nature. We provide commentary based on historical data and analyst forecasts only using an unbiased methodology and our articles are not intended to be financial advice. It does not constitute a recommendation to buy or sell any stock, and does not take account of your objectives, or your financial situation. We aim to bring you long-term focused analysis driven by fundamental data. Note that our analysis may not factor in the latest price-sensitive company announcements or qualitative material. Simply Wall St has no position in any stocks mentioned.
Have feedback on this article? Concerned about the content? Get in touch with us directly. Alternatively, email editorial-team@simplywallst.com
About NasdaqGM:WINA
Winmark
A resale company operates as a franchisor for small business in the United States and Canada.
Proven track record slight.
