- United States
- /
- Specialty Stores
- /
- NasdaqGS:TDUP
Examining ThredUp Stock After Its 1100% Rally Amid Surging Resale Market Momentum

Reviewed by Bailey Pemberton
If you have been watching ThredUp lately, you know it is one of those rare stocks that keeps drawing your attention. Whether you are holding after that massive 1-year surge or you are still weighing your next move, there is a lot to unpack. ThredUp has soared an eye-catching 1111.0% over the last year, with a staggering 568.8% gain year-to-date. Even after a recent 30-day dip of -10.7%, it has still notched a respectable 2.4% gain in the past week. This reminds investors that volatility can cut both ways, yet the underlying growth narrative is hard to ignore.
Much of this run can be traced back to growing enthusiasm around resale markets and shifts in how consumers value sustainability, with ThredUp positioning itself right in the sweet spot. As long-term trends shake up traditional retail, the company has found itself benefiting from a perception shift toward lower risk and newfound growth potential. That is not to say the ride has been smooth, but it is difficult to argue with those multi-hundred percent moves.
With ThredUp closing most recently at $9.43, valuation is top of mind: is it still a bargain, or have these gains made it pricey? According to standard valuation checks, ThredUp is currently undervalued in 3 out of 6 categories, resulting in a value score of 3. It is a mixed picture, possibly justifying the mixed mood among investors. Let’s break down how those valuation models try to nail down what ThredUp is really worth and why you might want an even sharper lens before making the call.
Approach 1: ThredUp Discounted Cash Flow (DCF) Analysis
A Discounted Cash Flow (DCF) model projects a company’s future cash flows and then discounts those estimates back to today, providing a way to estimate what the business is intrinsically worth. For ThredUp, the DCF model uses recent and forecasted free cash flow numbers to paint a clearer picture for investors.
ThredUp’s latest reported Free Cash Flow (FCF) stands at -$3.36 million, indicating negative current cash generation as it invests for growth. Analysts expect the company’s FCF to turn positive and reach $15.4 million by 2026. Looking further ahead, projections estimate free cash flow climbing as high as $216.7 million by 2035. The first five years of these forecasts are grounded in analyst estimates, while later figures are extrapolated using industry models from Simply Wall St.
Translating these projections into intrinsic value, the DCF model arrives at a fair value of $21.13 per share for ThredUp. With the stock trading at $9.43, this indicates the shares are trading at a 55.4% discount to intrinsic value, suggesting significant undervaluation based on future cash generation potential.
Result: UNDERVALUED
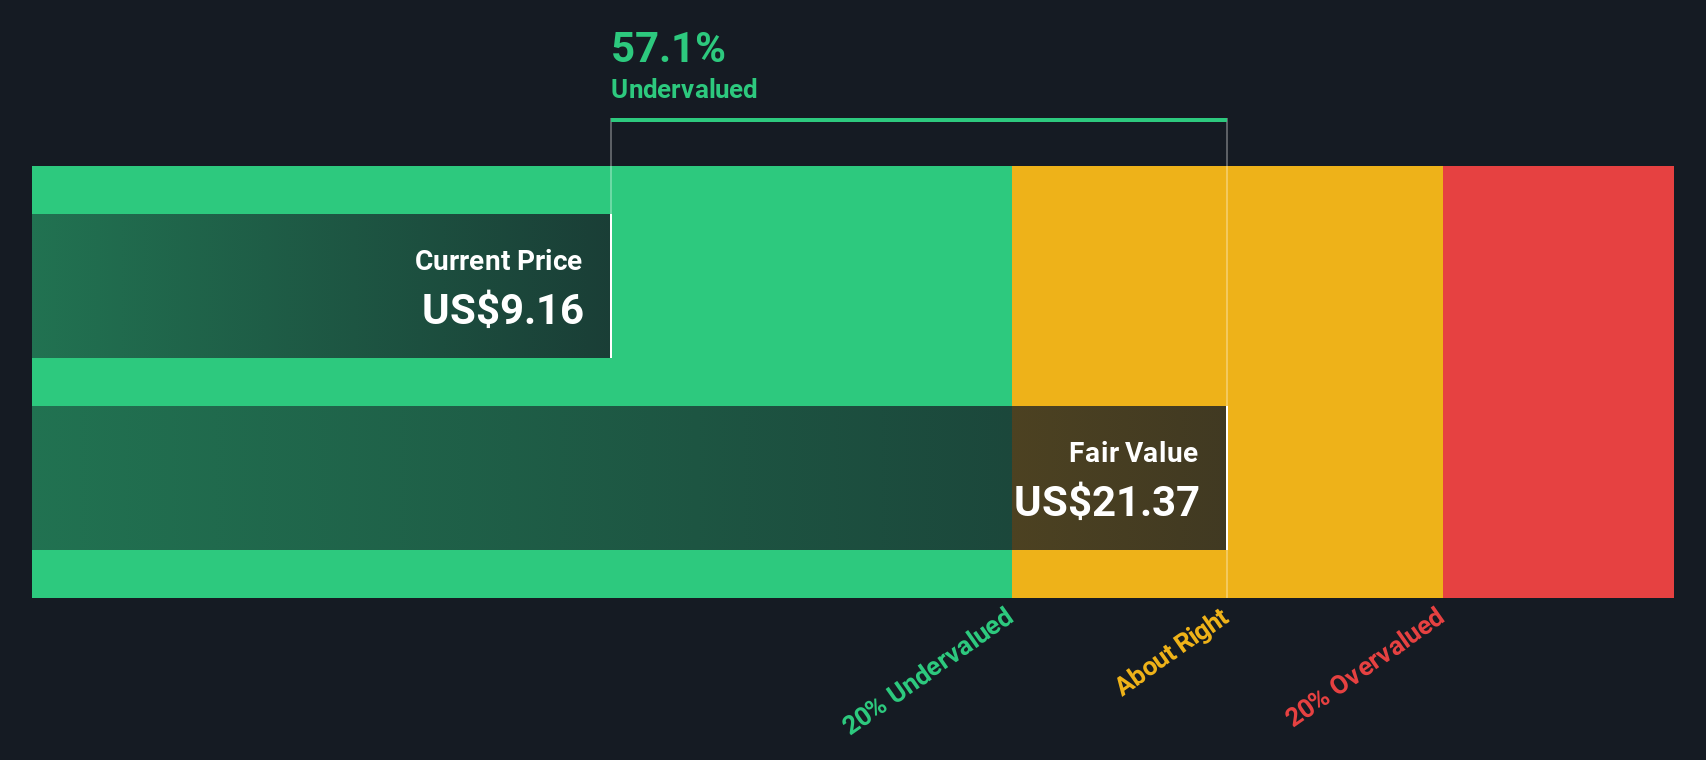
Our Discounted Cash Flow (DCF) analysis suggests ThredUp is undervalued by 55.4%. Track this in your watchlist or portfolio, or discover more undervalued stocks.
Approach 2: ThredUp Price vs Sales
The Price-to-Sales (P/S) ratio is the preferred multiple to assess ThredUp’s valuation, especially for companies that have yet to consistently achieve profitability but are growing revenues. For firms with uncertain or negative earnings, the P/S ratio allows investors to gauge value without the distortion that can arise from volatile earnings or near-term losses.
Both growth expectations and risk play significant roles in determining what constitutes a fair or "normal" P/S ratio. Higher anticipated sales growth tends to justify a loftier multiple, while elevated risk or inconsistent performance should temper that premium.
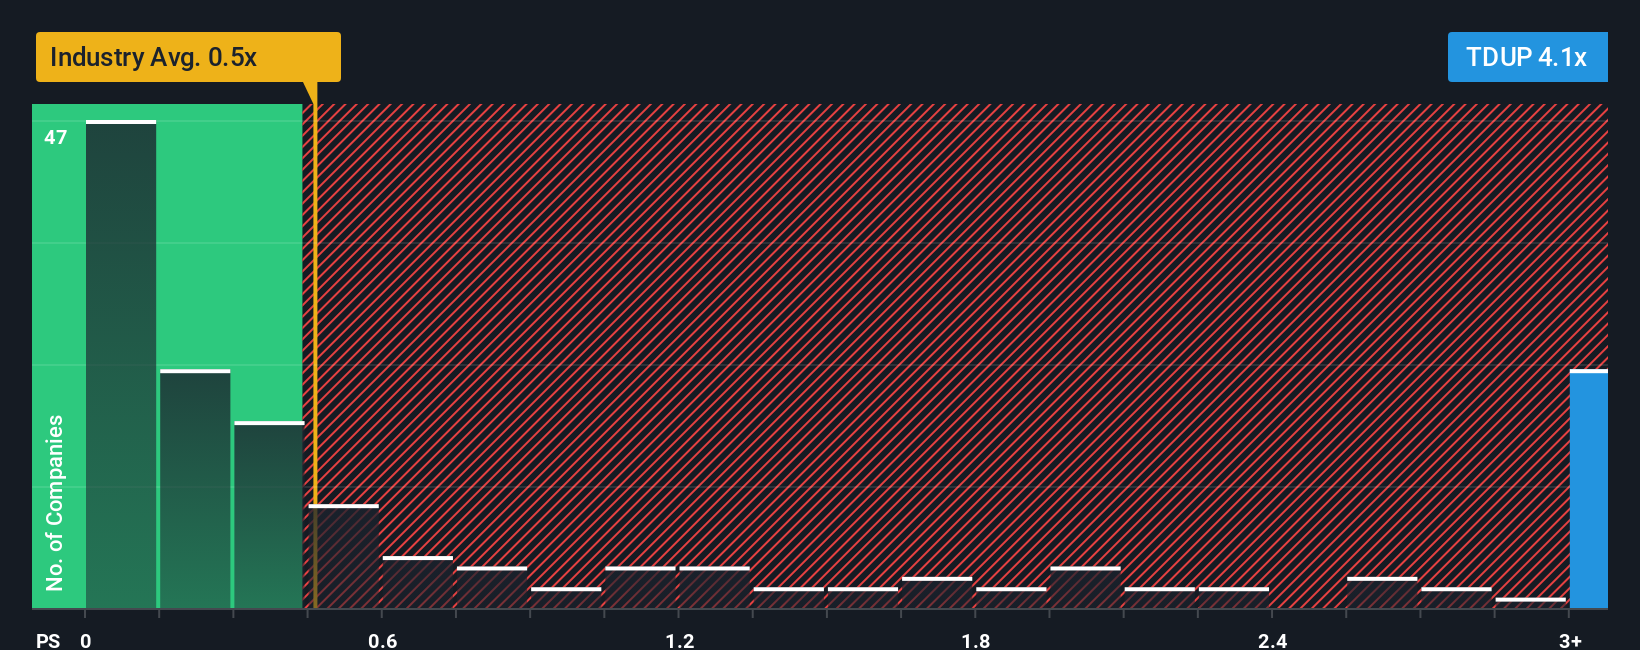
Currently, ThredUp’s P/S ratio stands at 4.18x. This is significantly above the Specialty Retail industry average of 0.51x and the peer average of 1.09x, reflecting the market’s optimism about ThredUp’s revenue growth potential. However, raw comparisons can overlook important company-specific factors.
This is where Simply Wall St’s proprietary “Fair Ratio” comes in. The Fair Ratio for ThredUp is 1.59x, which factors in elements such as expected revenue growth, profit margins, industry category, company size and risk adjustments. Unlike simple peer or industry multiples, the Fair Ratio delivers a more holistic benchmark tailored for each company.
By comparing the Fair Ratio of 1.59x to the current P/S ratio of 4.18x, ThredUp appears overvalued on this basis, trading well above the level justified by its fundamentals and risk profile.
Result: OVERVALUED
PS ratios tell one story, but what if the real opportunity lies elsewhere? Discover companies where insiders are betting big on explosive growth.
Upgrade Your Decision Making: Choose your ThredUp Narrative
Earlier we mentioned there is an even better way to understand valuation, so let’s introduce you to Narratives. A Narrative is a powerful, yet approachable way to connect your personal perspective on a company with the numbers that matter. Essentially, you create a “story” about ThredUp’s future (including your forecasts for revenue, profits, margins, and risks), and see how this story translates into a clear fair value estimate.
Narratives bridge the gap between raw data and real decisions by linking a company’s story to a financial forecast and then to an actionable fair value. They’re easy for anyone to use. On Simply Wall St’s Community page, millions of investors share and update these Narratives in real time as news or earnings data changes, so you’re never working with stale information.
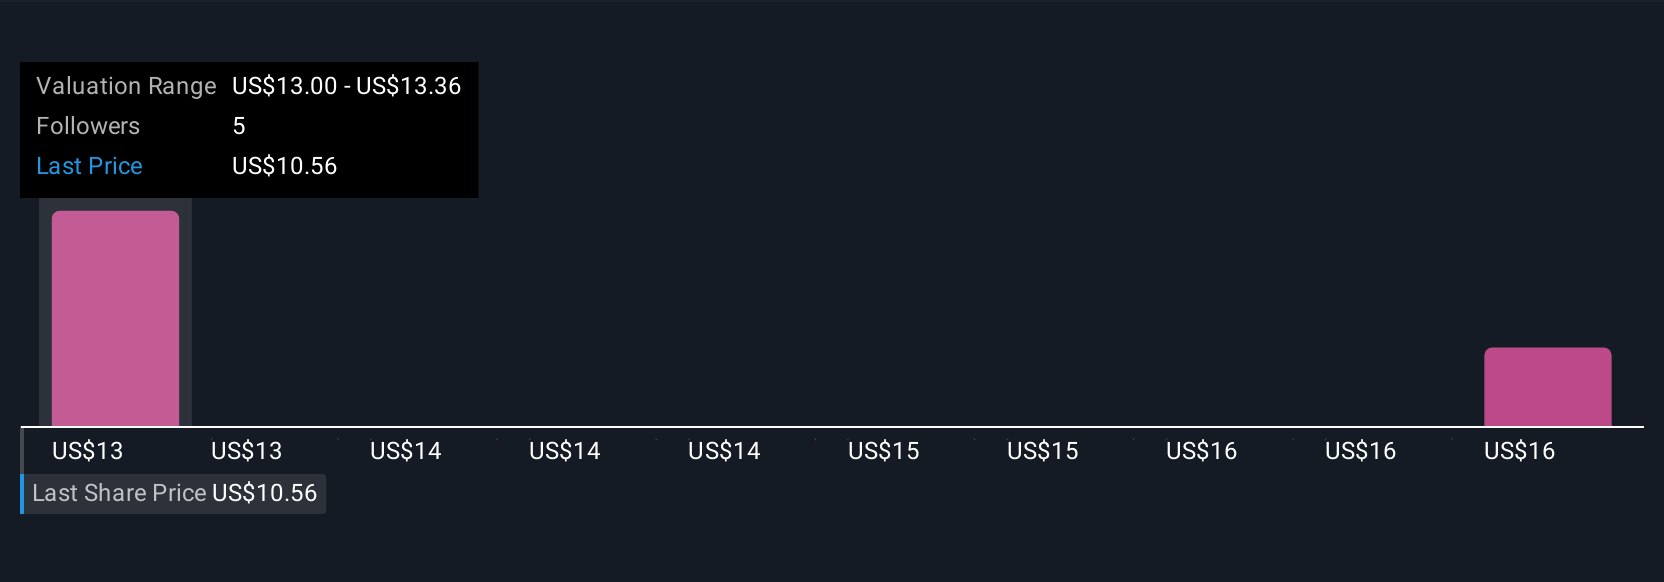
With Narratives, you can quickly see if your fair value is above or below the current price, helping you decide when to buy or sell, all based on your unique outlook. For ThredUp, one investor’s Narrative, built on bullish growth assumptions, might target a fair value of $21.13 per share. Another, more cautious view could settle at the consensus target of $13.00, demonstrating how Narratives let you invest according to your conviction, not just consensus.
Do you think there's more to the story for ThredUp? Create your own Narrative to let the Community know!
This article by Simply Wall St is general in nature. We provide commentary based on historical data and analyst forecasts only using an unbiased methodology and our articles are not intended to be financial advice. It does not constitute a recommendation to buy or sell any stock, and does not take account of your objectives, or your financial situation. We aim to bring you long-term focused analysis driven by fundamental data. Note that our analysis may not factor in the latest price-sensitive company announcements or qualitative material. Simply Wall St has no position in any stocks mentioned.
Mobile Infrastructure for Defense and Disaster
The next wave in robotics isn't humanoid. Its fully autonomous towers delivering 5G, ISR, and radar in under 30 minutes, anywhere.
Get the investor briefing before the next round of contracts
Sponsored On Behalf of CiTechValuation is complex, but we're here to simplify it.
Discover if ThredUp might be undervalued or overvalued with our detailed analysis, featuring fair value estimates, potential risks, dividends, insider trades, and its financial condition.
Access Free AnalysisHave feedback on this article? Concerned about the content? Get in touch with us directly. Alternatively, email editorial-team@simplywallst.com
About NasdaqGS:TDUP
Excellent balance sheet and fair value.
Similar Companies
Market Insights


Weekly Picks

Early mover in a fast growing industry. Likely to experience share price volatility as they scale


A case for CA$31.80 (undiluted), aka 8,616% upside from CA$0.37 (an 86 bagger!).


Moderation and Stabilisation: HOLD: Fair Price based on a 4-year Cycle is $12.08
Recently Updated Narratives


Title: Market Sentiment Is Dead Wrong — Here's Why PSEC Deserves a Second Look


An amazing opportunity to potentially get a 100 bagger

Amazon: Why the World’s Biggest Platform Still Runs on Invisible Economics
Popular Narratives


Crazy Undervalued 42 Baggers Silver Play (Active & Running Mine)


MicroVision will explode future revenue by 380.37% with a vision towards success


NVDA: Expanding AI Demand Will Drive Major Data Center Investments Through 2026
Trending Discussion
