
Advertisement
- United States
- /
- Specialty Stores
- /
- NasdaqGS:PRTS
CarParts.com, Inc.'s (NASDAQ:PRTS) 26% Dip Still Leaving Some Shareholders Feeling Restless Over Its P/SRatio
To the annoyance of some shareholders, CarParts.com, Inc. (NASDAQ:PRTS) shares are down a considerable 26% in the last month, which continues a horrid run for the company. For any long-term shareholders, the last month ends a year to forget by locking in a 74% share price decline.
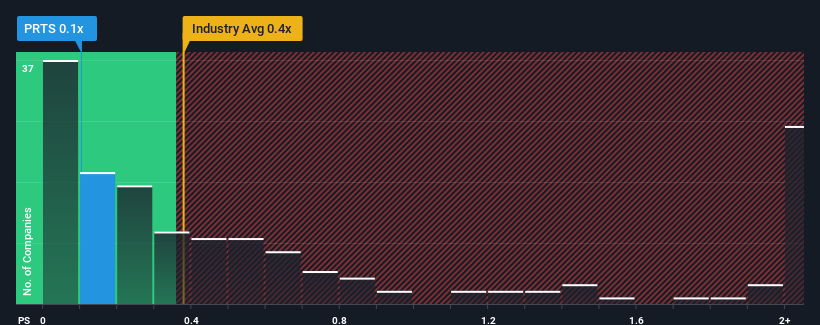
In spite of the heavy fall in price, it's still not a stretch to say that CarParts.com's price-to-sales (or "P/S") ratio of 0.1x right now seems quite "middle-of-the-road" compared to the Specialty Retail industry in the United States, where the median P/S ratio is around 0.4x. However, investors might be overlooking a clear opportunity or potential setback if there is no rational basis for the P/S.
See our latest analysis for CarParts.com
How CarParts.com Has Been Performing
CarParts.com could be doing better as it's been growing revenue less than most other companies lately. One possibility is that the P/S ratio is moderate because investors think this lacklustre revenue performance will turn around. If not, then existing shareholders may be a little nervous about the viability of the share price.
Keen to find out how analysts think CarParts.com's future stacks up against the industry? In that case, our free report is a great place to start.Do Revenue Forecasts Match The P/S Ratio?
The only time you'd be comfortable seeing a P/S like CarParts.com's is when the company's growth is tracking the industry closely.
Retrospectively, the last year delivered virtually the same number to the company's top line as the year before. Although pleasingly revenue has lifted 52% in aggregate from three years ago, notwithstanding the last 12 months. So while the company has done a solid job in the past, it's somewhat concerning to see revenue growth decline as much as it has.
Turning to the outlook, the next year should bring diminished returns, with revenue decreasing 0.8% as estimated by the dual analysts watching the company. With the industry predicted to deliver 3.6% growth, that's a disappointing outcome.
With this in consideration, we think it doesn't make sense that CarParts.com's P/S is closely matching its industry peers. It seems most investors are hoping for a turnaround in the company's business prospects, but the analyst cohort is not so confident this will happen. Only the boldest would assume these prices are sustainable as these declining revenues are likely to weigh on the share price eventually.
The Key Takeaway
CarParts.com's plummeting stock price has brought its P/S back to a similar region as the rest of the industry. While the price-to-sales ratio shouldn't be the defining factor in whether you buy a stock or not, it's quite a capable barometer of revenue expectations.
While CarParts.com's P/S isn't anything out of the ordinary for companies in the industry, we didn't expect it given forecasts of revenue decline. With this in mind, we don't feel the current P/S is justified as declining revenues are unlikely to support a more positive sentiment for long. If we consider the revenue outlook, the P/S seems to indicate that potential investors may be paying a premium for the stock.
And what about other risks? Every company has them, and we've spotted 4 warning signs for CarParts.com (of which 1 is a bit concerning!) you should know about.
If you're unsure about the strength of CarParts.com's business, why not explore our interactive list of stocks with solid business fundamentals for some other companies you may have missed.
New: AI Stock Screener & Alerts
Our new AI Stock Screener scans the market every day to uncover opportunities.
• Dividend Powerhouses (3%+ Yield)
• Undervalued Small Caps with Insider Buying
• High growth Tech and AI Companies
Or build your own from over 50 metrics.
Have feedback on this article? Concerned about the content? Get in touch with us directly. Alternatively, email editorial-team (at) simplywallst.com.
This article by Simply Wall St is general in nature. We provide commentary based on historical data and analyst forecasts only using an unbiased methodology and our articles are not intended to be financial advice. It does not constitute a recommendation to buy or sell any stock, and does not take account of your objectives, or your financial situation. We aim to bring you long-term focused analysis driven by fundamental data. Note that our analysis may not factor in the latest price-sensitive company announcements or qualitative material. Simply Wall St has no position in any stocks mentioned.
About NasdaqGS:PRTS
CarParts.com
Operates as an online retailer of aftermarket auto parts and accessories in the United States and the Philippines.
Moderate risk with adequate balance sheet.
Similar Companies
Market Insights

Advertisement
Community Narratives
MicroVision will explode future revenue by 380.37% with a vision towards success
Fair Value US$60.00|98.5% undervalued
TH
Community Contributor
The Indispensable Artery for a New North American Economy
Fair Value CA$132.87|2.3% undervalued
TI
Community Contributor