Advertisement
- United States
- /
- General Merchandise and Department Stores
- /
- NasdaqGS:AMZN
Is Amazoncom (AMZN) Offering Value After Recent Share Price Weakness And Mixed Growth Expectations

Reviewed by Bailey Pemberton
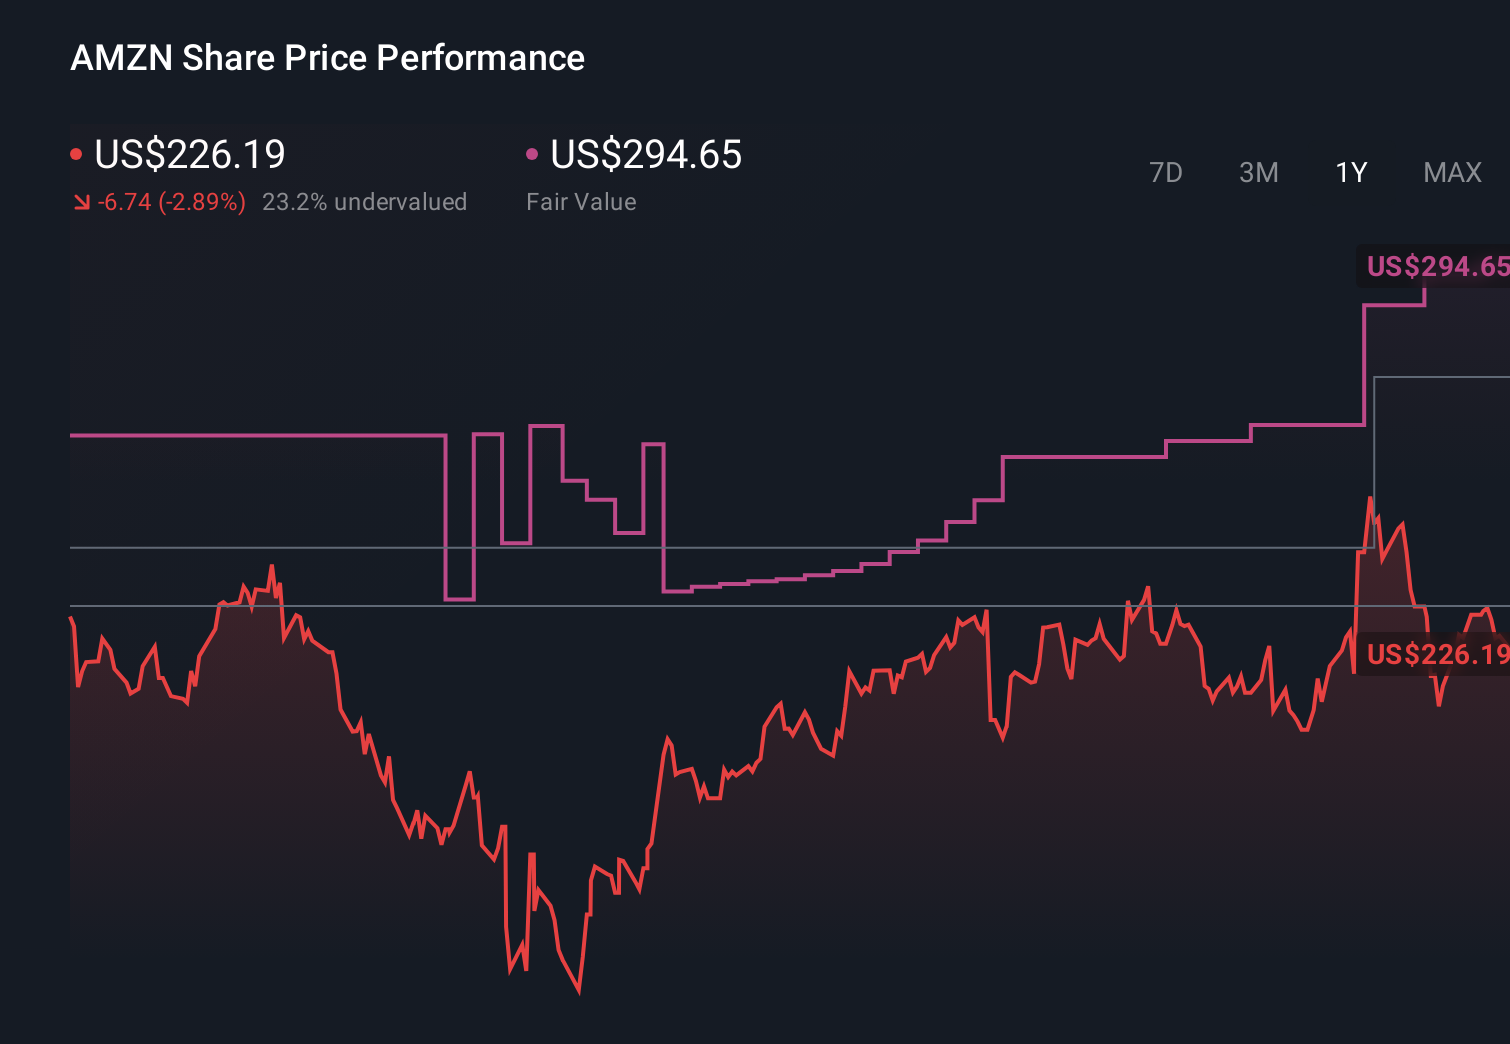
- If you have ever wondered whether Amazon.com shares still offer good value after years of strong performance, this article will walk through what the current price could be telling you.
- The stock last closed at US$208.72, with returns of a 14.1% decline over 7 days, a 15.6% decline over 30 days, a 7.8% decline year to date, a 10.5% decline over 1 year, 109.7% over 3 years and 27.4% over 5 years.
- These mixed returns come alongside ongoing coverage of Amazon.com's position in e commerce and cloud services, as investors continue to weigh the company's scale against expectations built into its share price. Recent commentary has focused on how large tech names like Amazon.com are being assessed not just on growth potential, but also on what investors are willing to pay for that growth.
- On our checks, Amazon.com scores 5 out of 6 for being undervalued, giving it a valuation score of 5. Next we will look at how different valuation methods line up on the stock, before finishing with a more complete way to think about what that score really means.
Find out why Amazon.com's -10.5% return over the last year is lagging behind its peers.
Approach 1: Amazon.com Discounted Cash Flow (DCF) Analysis
A Discounted Cash Flow, or DCF, model estimates what a company might be worth by projecting its future cash flows and discounting them back to today’s value.
For Amazon.com, the model uses a 2 Stage Free Cash Flow to Equity approach. The latest twelve month Free Cash Flow is about $40.1b. Analysts and extrapolated estimates point to Free Cash Flow of $179.6b in 2030, with intermediate projections that include a loss of $21.98b in 2026 and then rising positive cash flows through 2035. These future cash flows are all converted into today’s dollars using a discount rate.
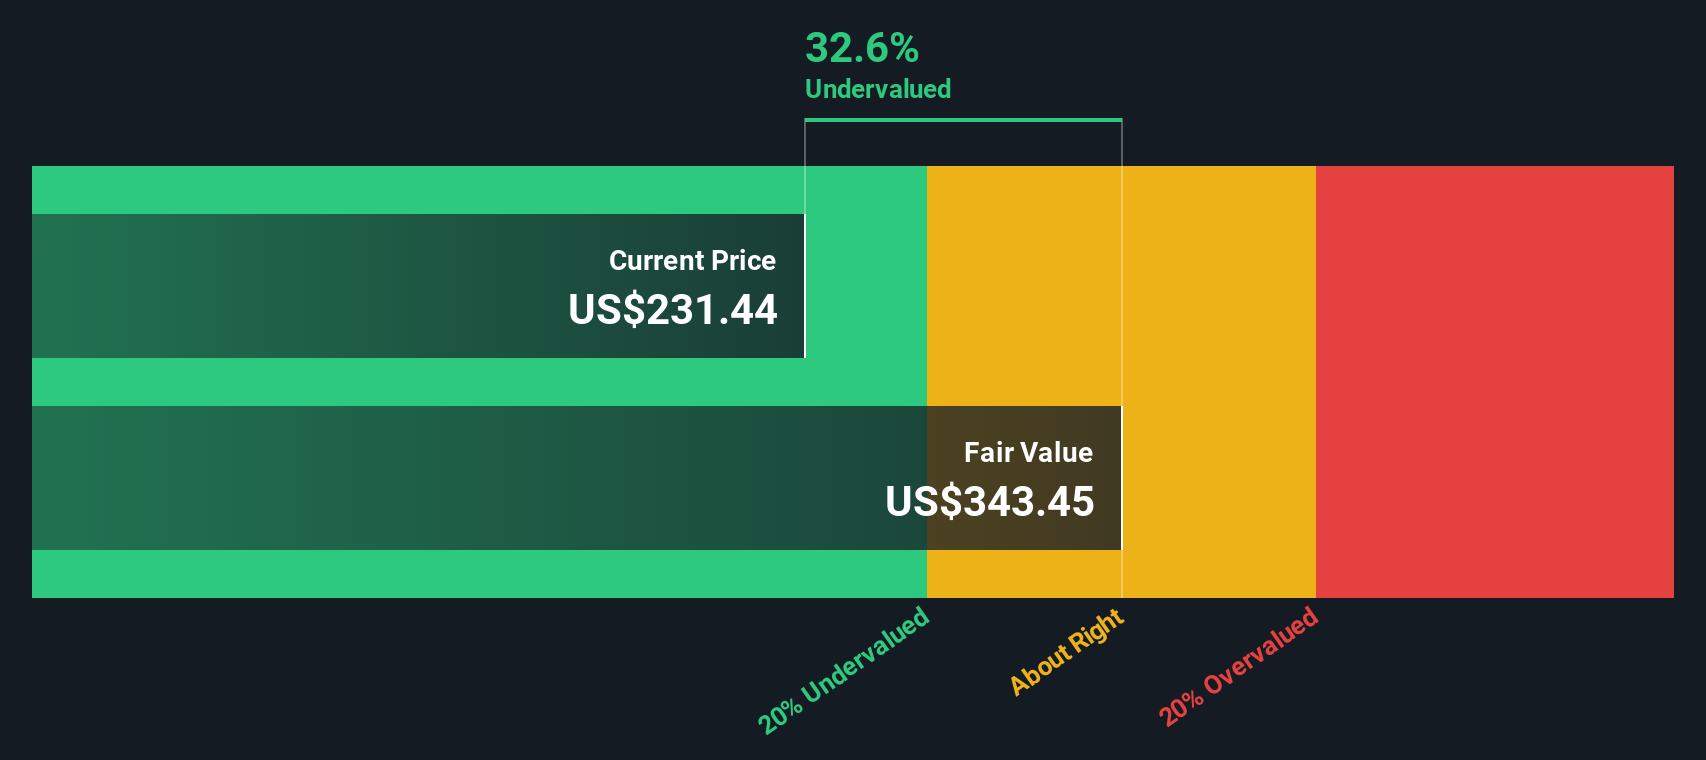
On this basis, the DCF model points to an estimated intrinsic value of about $345.14 per share. Against the recent share price of $208.72, this implies the stock is around 39.5% undervalued according to these assumptions and projections.
Result: UNDERVALUED
Our Discounted Cash Flow (DCF) analysis suggests Amazon.com is undervalued by 39.5%. Track this in your watchlist or portfolio, or discover 52 more high quality undervalued stocks.
Approach 2: Amazon.com Price vs Earnings
For a profitable company like Amazon.com, the P/E ratio is a useful way to think about what you are paying for each dollar of current earnings. The higher the growth that investors expect and the lower the perceived risk, the more they may be willing to pay, which usually shows up as a higher P/E. The opposite tends to be true if growth expectations are lower or risks feel higher.
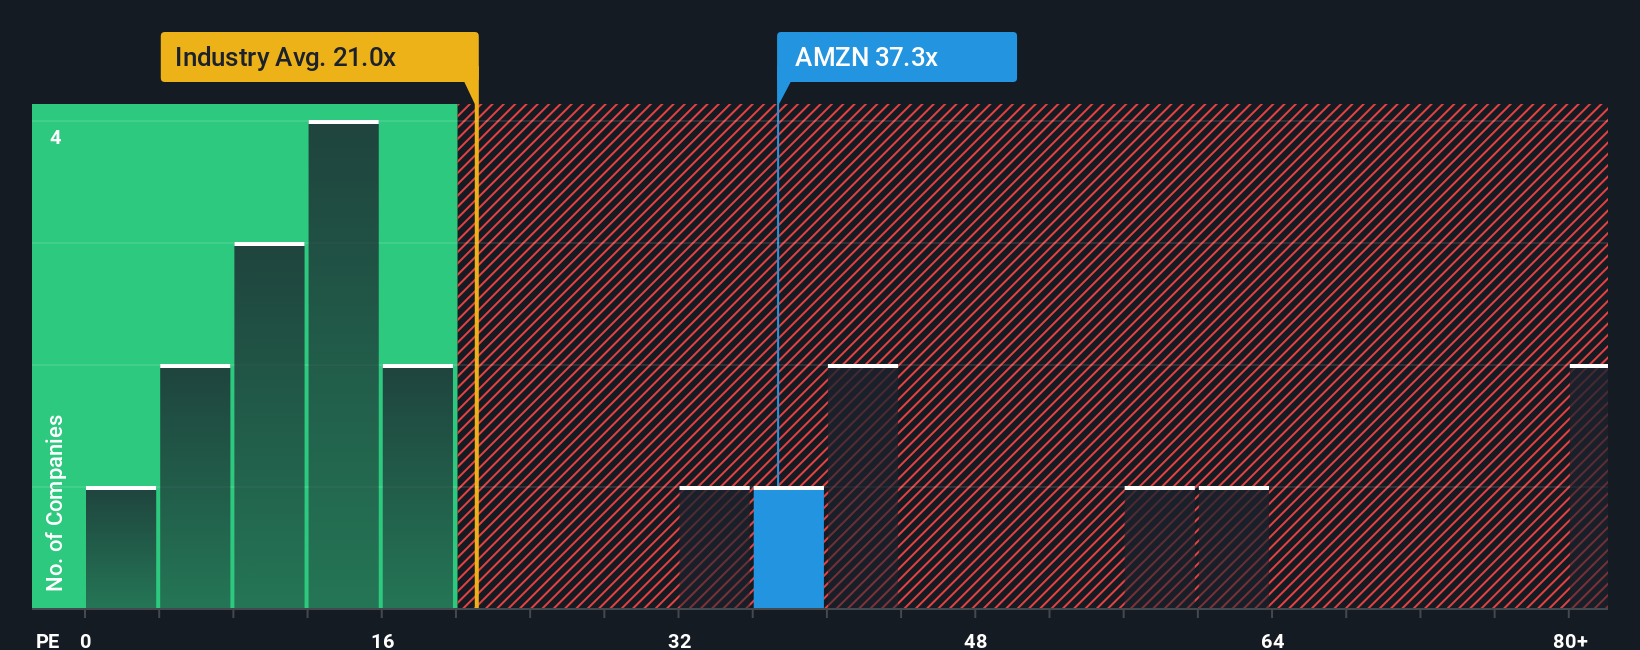
Amazon.com currently trades on a P/E of 28.85x. That sits above the Multiline Retail industry average P/E of 20.03x, but below the peer group average of 31.34x. Simply Wall St also calculates a “Fair Ratio” for Amazon.com of 41.99x, which is an estimate of what the P/E might be given factors like its earnings growth profile, industry, profit margins, market cap and risk profile.
This Fair Ratio is more tailored than a simple comparison with peers or an industry average, because it considers company specific drivers such as growth and risks as well as the type of business and its size. Comparing the Fair Ratio of 41.99x with the current P/E of 28.85x indicates that Amazon.com shares are trading below this Fair Ratio.
Result: UNDERVALUED
P/E ratios tell one story, but what if the real opportunity lies elsewhere? Start investing in legacies, not executives. Discover our 22 top founder-led companies.
Upgrade Your Decision Making: Choose your Amazon.com Narrative
Earlier we mentioned that there is an even better way to understand valuation, so let us introduce you to Narratives, a simple way for you to write the story you see for Amazon.com, link that story to your own assumptions for future revenue, earnings and margins, and then connect it to a Fair Value you can compare against the current share price.
On Simply Wall St, Narratives sit in the Community page and let you set out your view in plain language. You can then plug in numbers like your preferred discount rate or profit margin and instantly see how that flows through to a Fair Value that updates automatically when new data, news or earnings arrive.
That is helpful when you are deciding whether you think Amazon.com looks cheap or expensive, because you can compare your Fair Value to the current price and see how your conclusion differs from other investors, without anyone telling you what to do.
For example, one Amazon.com Narrative currently anchors on a Fair Value of about US$168.12 per share while another is closer to US$500. This shows how different investors, using the same company but different assumptions, can arrive at very different views on what the stock is worth today.
For Amazon.com however we will make it really easy for you with previews of two leading Amazon.com Narratives:
Fair value: US$234.75
Implied discount to this fair value at US$208.72: about 11.1% undervalued
Revenue growth assumption: 13.6%
- Emphasises Amazon's scale in e commerce, AWS and advertising, with a long list of recent customer wins and product launches across cloud, AI tools and logistics.
- Highlights both positives and risks, including competition in cloud, supply constraints in power and chips, and questions around how clearly the company communicates its AI plans.
- Sets a personal fair value of US$234.75 and outlines price levels the author is comfortable paying, based on their return targets and cash flow projections.
Fair value: US$168.12
Implied premium to this fair value at US$208.72: about 24.1% overvalued
Revenue growth assumption: 7.76%
- Scores Amazon on profitability, growth, balance sheet and competitive moat, while calling out share dilution and a relatively small gap between ROIC and cost of capital.
- Uses several valuation tools, including DCF, EPS growth and multiple based methods like EV/EBITDA, P/CF, P/S and P/B, with Monte Carlo simulations to test different scenarios.
- Arrives at a fair value of US$168.12 and concludes that, based on those inputs and discounts, Amazon looks fully priced or somewhat expensive at recent levels.
Together these two Narratives show how thoughtful investors, using the same public information and similar tools, can land on very different conclusions about Amazon.com's value. That range of views can be helpful context as you weigh your own assumptions about growth, profitability and what you are comfortable paying for the stock today.
When you are ready to frame your own thesis, reading the full Narratives and the details behind their numbers is a useful next step, and you can then build your own version alongside them using Narratives on Simply Wall St. Curious how numbers become stories that shape markets? Explore Community Narratives
Do you think there's more to the story for Amazon.com? Head over to our Community to see what others are saying!
This article by Simply Wall St is general in nature. We provide commentary based on historical data and analyst forecasts only using an unbiased methodology and our articles are not intended to be financial advice. It does not constitute a recommendation to buy or sell any stock, and does not take account of your objectives, or your financial situation. We aim to bring you long-term focused analysis driven by fundamental data. Note that our analysis may not factor in the latest price-sensitive company announcements or qualitative material. Simply Wall St has no position in any stocks mentioned.
New: Manage All Your Stock Portfolios in One Place
We've created the ultimate portfolio companion for stock investors, and it's free.
• Connect an unlimited number of Portfolios and see your total in one currency
• Be alerted to new Warning Signs or Risks via email or mobile
• Track the Fair Value of your stocks
Have feedback on this article? Concerned about the content? Get in touch with us directly. Alternatively, email editorial-team@simplywallst.com
About NasdaqGS:AMZN
Amazon.com
Engages in the retail sale of consumer products, advertising, and subscriptions service through online and physical stores in North America and internationally.
Solid track record with excellent balance sheet.
Similar Companies
Market Insights


Advertisement
Weekly Picks
CE


Ceazar on Sparc AI ·
When GPS fails: this small cap is fixing a $54B drone problem
Fair Value:CA$5.2540.2% undervalued
90 followersusers have followed this narrative
0 commentsusers have commented on this narrative
22 likesusers have liked this narrative
HE


HedgeY on IonQ ·
The Best-Funded Quantum Platform and Still a Stock Priced for Perfection
Fair Value:US$481.8% overvalued
33 followersusers have followed this narrative
0 commentsusers have commented on this narrative
9 likesusers have liked this narrative
BL


BlackGoat on Cerebras Systems ·
The Wafer Giant Threatening NVIDIA's GPU Hegemony
Fair Value:US$415.5453.8% undervalued
57 followersusers have followed this narrative
1 commentusers have commented on this narrative
10 likesusers have liked this narrative
IV

Ivoed on Netflix ·
Netflix’s Business Quality Is Clear. The Harder Question Is Whether The Stock Is Still Cheap
Fair Value:US$827.3% undervalued
28 followersusers have followed this narrative
2 commentsusers have commented on this narrative
10 likesusers have liked this narrative
Recently Updated Narratives
KE


Kentaiga on Microsoft ·
Microsoft Are Industry Leaders at a Heavy Discount
Fair Value:US$50022.7% undervalued
2 followersusers have followed this narrative
0 commentsusers have commented on this narrative
0 likesusers have liked this narrative
IV

Ivoed on SBM Offshore ·
Why SBM Offshore’s €30 Share Price May Be Too Harsh On Its Backlog
Fair Value:€44.529.7% undervalued
1 followerusers have followed this narrative
0 commentsusers have commented on this narrative
0 likesusers have liked this narrative
AN


AntonioS on Medibank Private ·
Medibank Private Limited. No Margin of Safety!
Fair Value:AU$3.830.8% overvalued
1 followerusers have followed this narrative
0 commentsusers have commented on this narrative
0 likesusers have liked this narrative
Popular Narratives
IN


Investingwilly on Mastercard ·
Mastercard: The Best Dividend Stock You're Ignoring
Fair Value:US$75028.9% undervalued
83 followersusers have followed this narrative
1 commentusers have commented on this narrative
9 likesusers have liked this narrative
HA


HarishPK on Adobe ·
Adobe: A Probabilistic Case for Undervaluation
Fair Value:US$319.9631.8% undervalued
64 followersusers have followed this narrative
9 commentsusers have commented on this narrative
19 likesusers have liked this narrative
NI

niteco on Broadcom ·
A Capital Allocation Favorite with Structural Importance
Fair Value:US$651.0542.6% undervalued
56 followersusers have followed this narrative
0 commentsusers have commented on this narrative
13 likesusers have liked this narrative
Trending Discussion


MW

mwod31 on Greatland Resources ·
A great comment, WSB have not done the research imo. I intend to buy more shares in 2026.
0
|0