Advertisement
- United States
- /
- General Merchandise and Department Stores
- /
- NasdaqGS:AMZN
Does Amazon’s Recent 6% Pullback Signal a New Opportunity for Investors in 2025?

Reviewed by Bailey Pemberton
- Wondering if Amazon.com is still a buy at today's prices? Whether you're sizing up a fresh investment or double-checking your current holding, the real story often starts with valuation.
- After a wild ride over the past year, Amazon.com has delivered a 12.0% gain. However, the last week saw a 6.0% dip that might have some investors on their toes.
- Much of the recent volatility can be traced to significant headlines around Amazon's ongoing antitrust investigations and moves to expand its AI service suite. Both of these have caught Wall Street's attention and are shaping opinions on the company's long-term growth and risk profile, beyond the usual market chatter.
- Right now, Amazon.com scores 5 out of 6 on our valuation checks, which puts it at the top of the class for undervaluation. We'll break down the popular ways to value Amazon next, but stick around for a deeper approach that goes beyond the numbers.
Find out why Amazon.com's 12.0% return over the last year is lagging behind its peers.
Approach 1: Amazon.com Discounted Cash Flow (DCF) Analysis
The Discounted Cash Flow (DCF) model estimates a company's value by projecting its future cash flows and discounting them back to their present value. For Amazon.com, this approach looks at how much money the business generates in actual cash today and forecasts how much that figure could grow in the coming years.
Currently, Amazon.com reports a Free Cash Flow (FCF) of $40.04 billion. Analysts project strong growth in the years ahead, with estimates showing FCF could reach $141.87 billion by 2029. While reliable analyst forecasts generally extend up to five years, later projections are extrapolated to give a comprehensive ten-year trajectory.
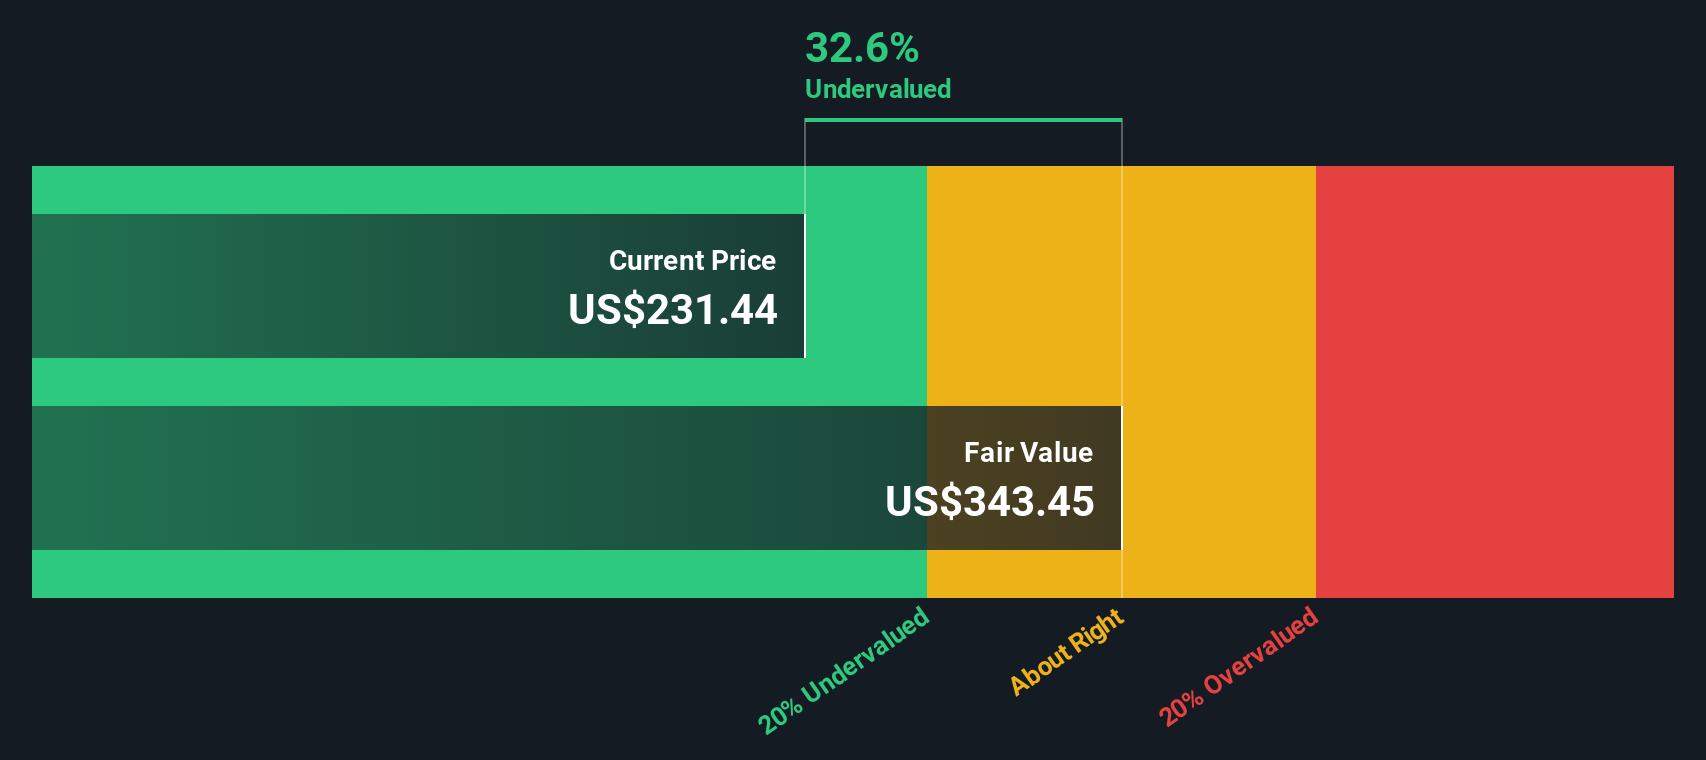
By applying these projections and discounting each year's expected cash flow, the DCF model arrives at an intrinsic value of $303.07 per share. Compared to today's market price, this implies the stock is trading at a 27.2% discount, which may indicate notable undervaluation.
The data signals that, despite recent stock volatility and headline risk, Amazon.com may be meaningfully undervalued when considering its cash generation power and long-term growth runway.
Result: UNDERVALUED
Our Discounted Cash Flow (DCF) analysis suggests Amazon.com is undervalued by 27.2%. Track this in your watchlist or portfolio, or discover 926 more undervalued stocks based on cash flows.
Approach 2: Amazon.com Price vs Earnings (PE)
The Price-to-Earnings (PE) ratio is one of the most widely used valuation tools for established, profitable companies like Amazon.com. It captures how much investors are willing to pay for each dollar of a company’s earnings, making it a straightforward way to compare value across businesses that are consistently generating profits.
The “right” PE ratio depends on a company’s growth prospects and risk profile. Higher growth or lower risk companies generally command higher PE multiples, reflecting investor optimism about future earnings. Conversely, companies with lower growth or more uncertainty typically trade at lower PE ratios.
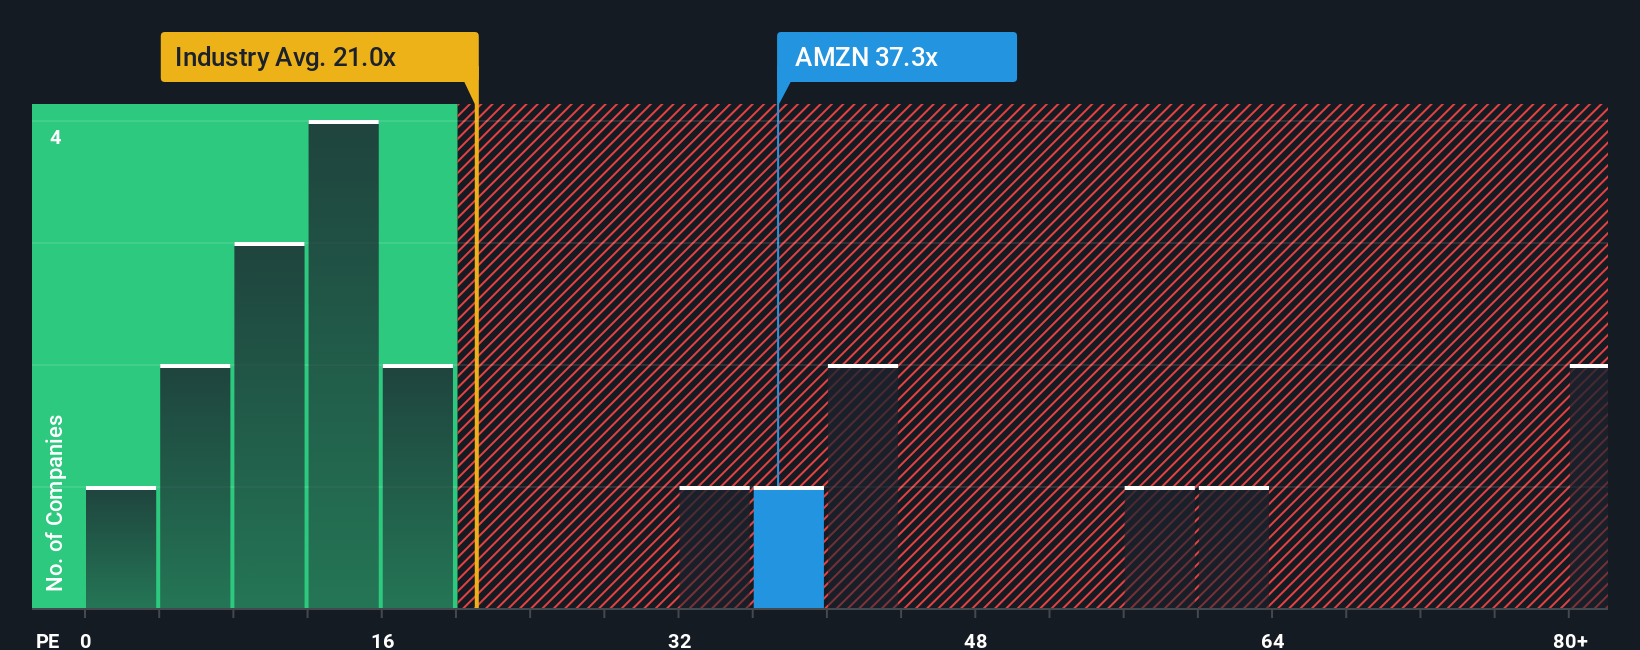
Currently, Amazon.com trades at a PE ratio of 30.8x. This is notably higher than the Multiline Retail industry average of 19.0x, but actually a bit below the average of its direct peers at 32.5x. While these benchmarks provide some context, they do not fully account for Amazon’s unique growth profile, profitability, and scale.
This is where the Simply Wall St “Fair Ratio” comes into play. The Fair Ratio for Amazon is 36.4x, calculated by factoring in company-specific attributes like expected earnings growth, profit margins, size, industry position, and risk factors. Unlike a simple industry or peer comparison, the Fair Ratio offers a nuanced benchmark tailored specifically to Amazon’s outlook and characteristics.
Comparing Amazon’s current PE of 30.8x to its Fair Ratio of 36.4x suggests the stock is trading well below where it should be given its strengths and growth trajectory. On this basis, the stock appears undervalued by the PE approach.
Result: UNDERVALUED
PE ratios tell one story, but what if the real opportunity lies elsewhere? Discover 1430 companies where insiders are betting big on explosive growth.
Upgrade Your Decision Making: Choose your Amazon.com Narrative
Earlier, we mentioned there’s an even better way to understand valuation. Let’s introduce you to Narratives, a tool that empowers you to connect your own story about Amazon.com directly to forecasts and fair value estimates.
A Narrative is your personal, data-backed perspective on a company, making it easy to map how you see Amazon’s business evolving and why. It combines your assumptions about growth, margins, and risks with a clear financial forecast and resulting fair value.
Narratives are fast and intuitive, and are available on Simply Wall St’s Community page, where millions of investors share and update their perspectives. All narratives are dynamically adjusted when earnings, news, or new information comes in.
By comparing your Narrative’s fair value with Amazon.com’s current price, you can quickly assess whether you think it’s a buy, hold, or sell and see how your reasoning stacks up against other investors’ logic in real time.
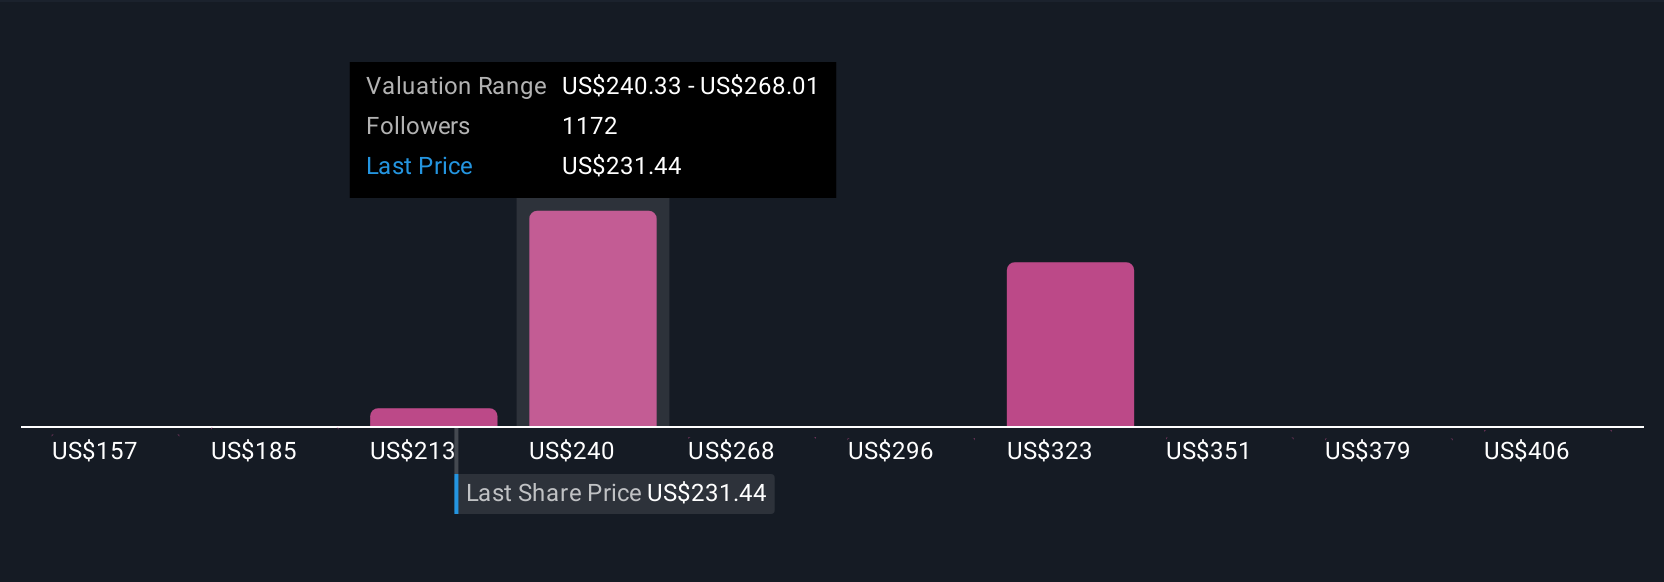
For example, one narrative values Amazon at $293, assuming strong AI-fueled revenue growth and expanding margins, while another sees fair value at $217, using more cautious profit assumptions. This demonstrates just how powerfully your Narrative shapes your investment view.
For Amazon.com, we'll make it really easy for you with previews of two leading Amazon.com Narratives:
- 🐂 Amazon.com Bull Case
Fair Value: $222.55
Current Price: $220.69, which is 0.84% below fair value
Revenue Growth Rate: 15.19%
- Amazon’s long-term earnings power is driven by rapid growth in higher-margin businesses like AWS, Advertising, and third-party sellers.
- Heavy reinvestment in core opportunities is expected to suppress free cash flow in the near term, but operating leverage and global expansion provide a robust growth runway.
- Regulatory and recession risks exist, but the company is seen as well positioned to handle headwinds due to its scale, infrastructure, and customer-centric approach.
- 🐻 Amazon.com Bear Case
Fair Value: $217.95
Current Price: $220.69, which is 1.26% above fair value
Revenue Growth Rate: 8.08%
- Amazon's diversification and rapid high-margin growth from AWS have improved overall profitability, but its revenue growth is expected to moderate as the company matures.
- Operating margins and returns on capital are forecast to increase as AWS becomes a larger share of the business, but future growth rates could be lower than in recent years.
- The discounted cash flow model values Amazon at or near its current market price, suggesting limited upside and a fairly valued stock unless growth or profitability beat expectations.
Do you think there's more to the story for Amazon.com? Head over to our Community to see what others are saying!
This article by Simply Wall St is general in nature. We provide commentary based on historical data and analyst forecasts only using an unbiased methodology and our articles are not intended to be financial advice. It does not constitute a recommendation to buy or sell any stock, and does not take account of your objectives, or your financial situation. We aim to bring you long-term focused analysis driven by fundamental data. Note that our analysis may not factor in the latest price-sensitive company announcements or qualitative material. Simply Wall St has no position in any stocks mentioned.
New: Manage All Your Stock Portfolios in One Place
We've created the ultimate portfolio companion for stock investors, and it's free.
• Connect an unlimited number of Portfolios and see your total in one currency
• Be alerted to new Warning Signs or Risks via email or mobile
• Track the Fair Value of your stocks
Have feedback on this article? Concerned about the content? Get in touch with us directly. Alternatively, email editorial-team@simplywallst.com
About NasdaqGS:AMZN
Amazon.com
Engages in the retail sale of consumer products, advertising, and subscriptions service through online and physical stores in North America and internationally.
Solid track record with excellent balance sheet.
Similar Companies
Market Insights


Advertisement
Weekly Picks
LO


Lou_Basenese on Cue Biopharma ·
Cue Biopharma (NASDAQ: CUE): The Scientist Behind Xolair Just Gave Cue a Next-Generation Shot at the Same Multi-Billion-Dollar Market
Fair Value:US$7057.9% undervalued
18 followersusers have followed this narrative
0 commentsusers have commented on this narrative
5 likesusers have liked this narrative
HE


HedgeY on AST SpaceMobile ·
AST SpaceMobile: The Boldest Direct-to-Cell Bet in Public Markets
Fair Value:US$17044.9% undervalued
36 followersusers have followed this narrative
0 commentsusers have commented on this narrative
12 likesusers have liked this narrative
FU

FundamentalFlow on Onto Innovation ·
Onto Innovation: The Advanced Packaging Chokepoint 51.3% undervalued intrinsic discount
Fair Value:US$38033.4% undervalued
25 followersusers have followed this narrative
0 commentsusers have commented on this narrative
6 likesusers have liked this narrative
MA


martinarauz on Nu Holdings ·
Investment Analysis (May 2026)
Fair Value:US$22.7447.4% undervalued
58 followersusers have followed this narrative
0 commentsusers have commented on this narrative
15 likesusers have liked this narrative
Recently Updated Narratives
QU


QuanD on Space Exploration Technologies ·
Making sense of 1.75 trillion IPO
Fair Value:US$1350% overvalued
1 followerusers have followed this narrative
0 commentsusers have commented on this narrative
0 likesusers have liked this narrative
MA
Marek_Trnka on Space Exploration Technologies ·
SpaceX? Only Fast in - Fast out!
Fair Value:US$1350% overvalued
3 followersusers have followed this narrative
0 commentsusers have commented on this narrative
0 likesusers have liked this narrative
HA


Harshvardhan on Indian Oil ·
INDIAN OIL CORPORATION IS THE TITAN IN TRANSITION
Fair Value:₹21435.4% undervalued
1 followerusers have followed this narrative
0 commentsusers have commented on this narrative
0 likesusers have liked this narrative
Popular Narratives
MA
martinarauz on Nu Holdings ·
Investment Analysis (May 2026)
Fair Value:US$22.7447.4% undervalued
58 followersusers have followed this narrative
0 commentsusers have commented on this narrative
15 likesusers have liked this narrative
CL


Clive_Thompson on Take-Two Interactive Software ·
Take-Two Interactive: The Calm Before the Storm NASDAQ: TTWO Last Price: $242.41 Date: May 15, 2026
Fair Value:US$276.9722.6% undervalued
57 followersusers have followed this narrative
0 commentsusers have commented on this narrative
14 likesusers have liked this narrative
NI

niteco on Honeywell International ·
Honeywell - The Demand-Side of the AI Infrastructure
Fair Value:US$320.1933.2% undervalued
48 followersusers have followed this narrative
0 commentsusers have commented on this narrative
19 likesusers have liked this narrative
Trending Discussion
CO


composite32 on Ronesans Gayrimenkul Yatirim ·
Selamlar Teşekkürler.. Radarımda olan bir şirket değil, Halka açıklık oranı %40'ın üzerinde olan şir...
0
|0

FR

FrontierTom on United States Antimony ·
Great Long term play that needs great tolerance for price swings along the way.
0
|0