Advertisement
- United States
- /
- General Merchandise and Department Stores
- /
- NasdaqGS:AMZN
Assessing Amazon.com (AMZN) Valuation After Recent Mixed Share Price Performance
Amazon.com stock in focus after recent performance data
Amazon.com (AMZN) is back on investors’ radar after a mixed stretch, with a slight gain over the past month, a modest rise in the past 3 months, and a small 1 year total return decline.
See our latest analysis for Amazon.com.
At a share price of US$231.30, Amazon.com’s recent 7 day share price pullback sits alongside a positive 90 day share price return of 4.62% and a three year total shareholder return of around 2.4x. This suggests longer term momentum has been stronger than the near term moves.
If Amazon.com’s shift catches your eye, it can also be worth scanning other large tech names and AI plays through high growth tech and AI stocks to see what else fits your thesis.
With Amazon.com trading at US$231.30, some investors will focus on its discount to analyst targets and intrinsic estimates, while others may see recent returns as fair value. This raises the question: is this a potential entry point, or is future growth already priced in?
Price-to-Earnings of 32.3x: Is it justified?
At a last close of US$231.30, Amazon.com is trading on a P/E of 32.3x, which sits slightly below its peer average yet above the broader multiline retail industry.
The P/E multiple compares the share price with earnings per share, so a higher figure usually means investors are willing to pay more today for each dollar of current earnings. For a large platform business with diverse revenue streams and meaningful profit growth forecasts, that kind of premium often reflects expectations that earnings will keep building over time.
Amazon.com is described as expensive versus the Global Multiline Retail industry average P/E of 19.9x, which is a sizeable premium. However, relative to its closer peer group, the 32.3x P/E is slightly below the 33x average, and also below an estimated fair P/E of 40.9x that our work suggests the market could move toward if current assumptions hold.
Explore the SWS fair ratio for Amazon.com
Result: Price-to-Earnings of 32.3x (ABOUT RIGHT)
However, the case can shift quickly if AWS growth, advertising demand or retail margins soften, or if competition and regulation push profit expectations lower.
Find out about the key risks to this Amazon.com narrative.
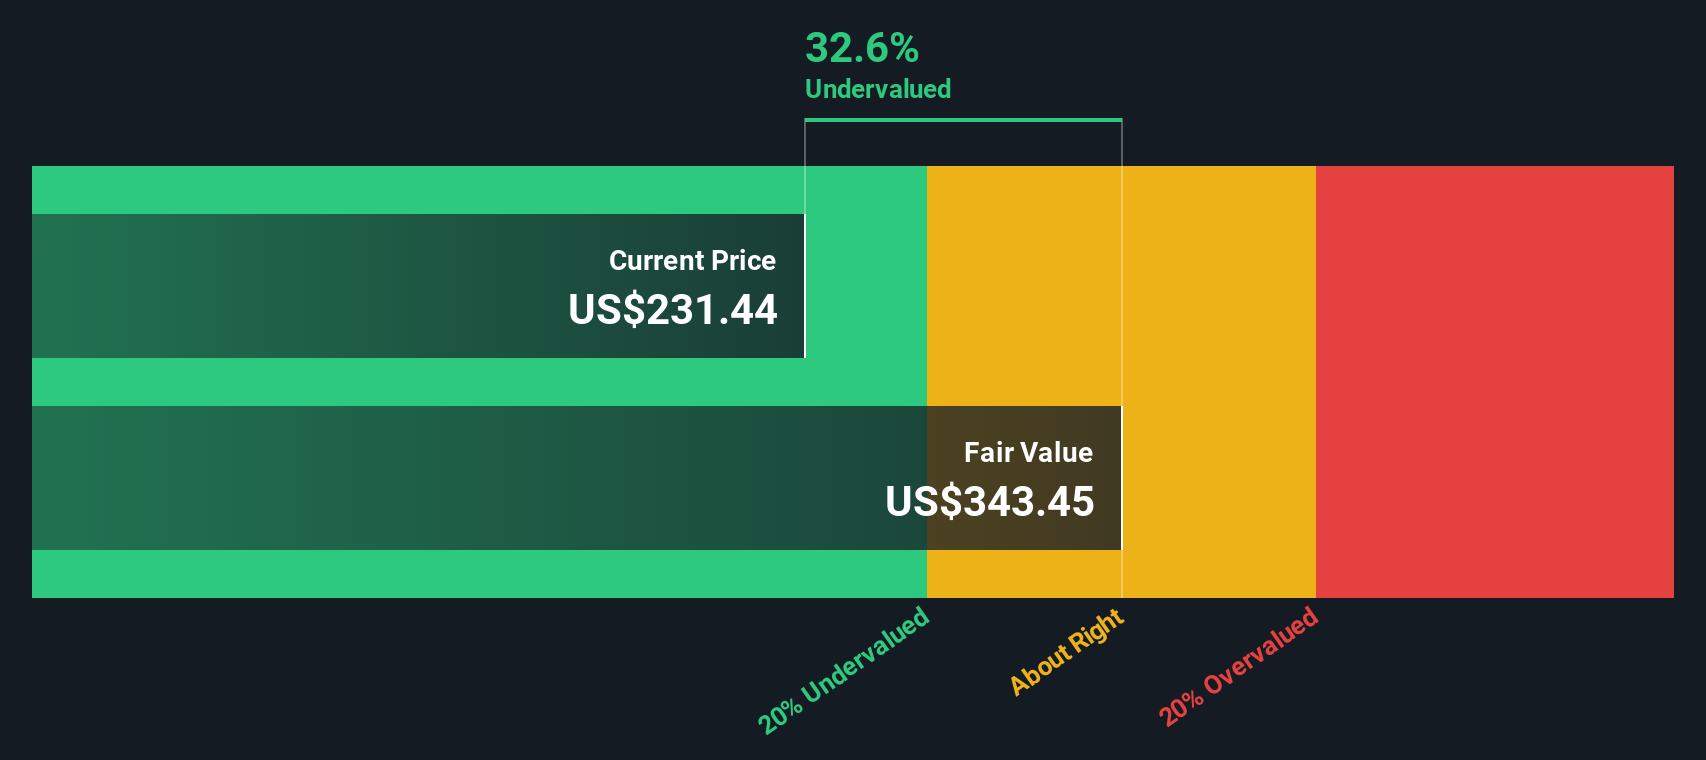
Another view, using our DCF model
Our DCF model points in a different direction. With Amazon.com at US$231.30 and our estimate of future cash flow value at US$376.19, the shares screen as undervalued by roughly 38.5%. That is a wide gap, so which story do you lean on, earnings multiples or cash flows?
Look into how the SWS DCF model arrives at its fair value.
Simply Wall St performs a discounted cash flow (DCF) on every stock in the world every day (check out Amazon.com for example). We show the entire calculation in full. You can track the result in your watchlist or portfolio and be alerted when this changes, or use our stock screener to discover 881 undervalued stocks based on their cash flows. If you save a screener we even alert you when new companies match - so you never miss a potential opportunity.
Build Your Own Amazon.com Narrative
If you see the numbers differently or prefer to rely on your own work, you can review the data and craft a full thesis in minutes, starting with Do it your way.
A great starting point for your Amazon.com research is our analysis highlighting 4 key rewards and 1 important warning sign that could impact your investment decision.
Looking for more investment ideas beyond Amazon.com?
If you stop with just one stock, you might miss out on other opportunities, so use the screener to quickly surface ideas that actually match your approach.
- Spot potential value candidates by checking out these 881 undervalued stocks based on cash flows that line up with your preferred balance of price and fundamentals.
- Catch emerging AI themes early by scanning these 23 AI penny stocks that sit at the intersection of software, hardware, and real world data use cases.
- Tap into digital asset trends by reviewing these 19 cryptocurrency and blockchain stocks that are tied to blockchain, payments, and related infrastructure plays.
This article by Simply Wall St is general in nature. We provide commentary based on historical data and analyst forecasts only using an unbiased methodology and our articles are not intended to be financial advice. It does not constitute a recommendation to buy or sell any stock, and does not take account of your objectives, or your financial situation. We aim to bring you long-term focused analysis driven by fundamental data. Note that our analysis may not factor in the latest price-sensitive company announcements or qualitative material. Simply Wall St has no position in any stocks mentioned.
New: Manage All Your Stock Portfolios in One Place
We've created the ultimate portfolio companion for stock investors, and it's free.
• Connect an unlimited number of Portfolios and see your total in one currency
• Be alerted to new Warning Signs or Risks via email or mobile
• Track the Fair Value of your stocks
Have feedback on this article? Concerned about the content? Get in touch with us directly. Alternatively, email editorial-team@simplywallst.com
About NasdaqGS:AMZN
Amazon.com
Engages in the retail sale of consumer products, advertising, and subscriptions service through online and physical stores in North America and internationally.
Undervalued with solid track record.
Similar Companies
Market Insights


Advertisement
Weekly Picks
LO


Lou_Basenese on Optimi Health ·
The Only Psychedelic Company Already Selling MDMA and Psilocybin to Real Patients, Yet Priced Like It Doesn’t Exist
Fair Value:US$1155.3% undervalued
50 followersusers have followed this narrative
2 commentsusers have commented on this narrative
9 likesusers have liked this narrative
WE


WealthAP on Novo Nordisk ·
Novo Nordisk (NVO): Is the "Easy Growth" Story Over?
Fair Value:DKK 407.7719.9% undervalued
69 followersusers have followed this narrative
0 commentsusers have commented on this narrative
8 likesusers have liked this narrative
VA


ValueInvestingSubstack on Zoetis ·
Zoetis down -50% over the past year
Fair Value:US$92.9217.2% undervalued
24 followersusers have followed this narrative
0 commentsusers have commented on this narrative
9 likesusers have liked this narrative
CE


CentryResearch on Centrus Energy ·
Centrus Energy: The Next Nuclear Bottleneck Isn't Reactors. It's Fuel.
Fair Value:US$1907.4% undervalued
24 followersusers have followed this narrative
0 commentsusers have commented on this narrative
11 likesusers have liked this narrative
Recently Updated Narratives
CL


Clive_Thompson on Green Tea Group ·
One of China's Fastest-Growing Restaurant Chains Trades on Just 7x Earnings and an 8% Dividend
Fair Value:HK$8.728.0% undervalued
1 followerusers have followed this narrative
0 commentsusers have commented on this narrative
0 likesusers have liked this narrative
AZ

aziz_22khi on PRG Holdings Berhad ·
WHERE DID THE SIX MILLION SHARES GO? THE PRG OWNERSHIP TRAIL INVESTORS CANNOT IGNORE
Fair Value:RM 0.4477.3% undervalued
1 followerusers have followed this narrative
0 commentsusers have commented on this narrative
0 likesusers have liked this narrative
BR


Brunhilde_Wagner on Copart ·
Compounder to Cash Generator in Real Time
Fair Value:US$2710.3% overvalued
1 followerusers have followed this narrative
0 commentsusers have commented on this narrative
0 likesusers have liked this narrative
Popular Narratives
CU

CubanEros on Microsoft ·
A wonderful business at reasonable price.
Fair Value:US$419.917.3% undervalued
86 followersusers have followed this narrative
0 commentsusers have commented on this narrative
6 likesusers have liked this narrative
OS


oscargarcia on NVIDIA ·
The company that went from selling GPUs to gamers to becoming the AI arms dealer of the 21st century.
Fair Value:US$28029.8% undervalued
195 followersusers have followed this narrative
9 commentsusers have commented on this narrative
15 likesusers have liked this narrative
BE

benjamin_lvieq on PayPal Holdings ·
PayPal: PayPal Doesn't Need to Grow – It Needs to Stop Falling – A Mispriced Cash Machine With a Cannibal Buyback
Fair Value:US$6513.7% undervalued
72 followersusers have followed this narrative
2 commentsusers have commented on this narrative
11 likesusers have liked this narrative
Trending Discussion
DE

derek_3wsdg on Teladoc Health ·
You’ve overlooked the activist investor factor. Travis Cocke’s Voss has announced 5% ownership through a 13G filing. They’ve added to that 5% since, and in doing so, have created a structural trap door for 27.42 Million Shares actively sold short. Chuck will announce lots of positives on July 29 but it’s what Voss announces shortly after that will rock the overextended Teledoc shorts. The Walmart partnership is the tip of the iceberg. The market is missing the sheer regulatory and enterprise friction of modern corporate healthcare. Teladoc isn't a "consumer app"; it is the primary digital infrastructure integrated directly into the legacy backends of Tier-1 insurance companies and fortune 500 employers, covering 105 million+ lives. Teladoc is acting as the digital top-of-funnel engine for the world's largest retailer. If Voss pushes the narrative that Teladoc is effectively the outsourced digital brain of Walmart's entire healthcare footprint, the fair value shifts from a basic health multiple to an enterprise distribution premium. Additionally , we are in a structural gold rush for high-quality, legally compliant, longitudinal medical data to train vertical healthcare AI models. Large technology hyperscalers and pharmaceutical giants cannot simply scrape the internet for this; they need structured clinical inputs. Teladoc sits on one of the largest de-identified virtual medical datasets on earth. From the activist playbook , we’ll see Voss demand the immediate creation of a Data & Diagnostics Licensing Division, transforming a legacy liability into an incredibly high-margin, pure-software data asset that requires zero human clinician hours to scale. Chuck is doing great work and deserves credi5 for the Teledoc turnaround but it will be Travis Cocke who will be responsible for a share price way beyond your $15 valuation.
1
|0

